> ## Documentation Index
> Fetch the complete documentation index at: https://docs.cloosphere.ai/llms.txt
> Use this file to discover all available pages before exploring further.
# Monitoring
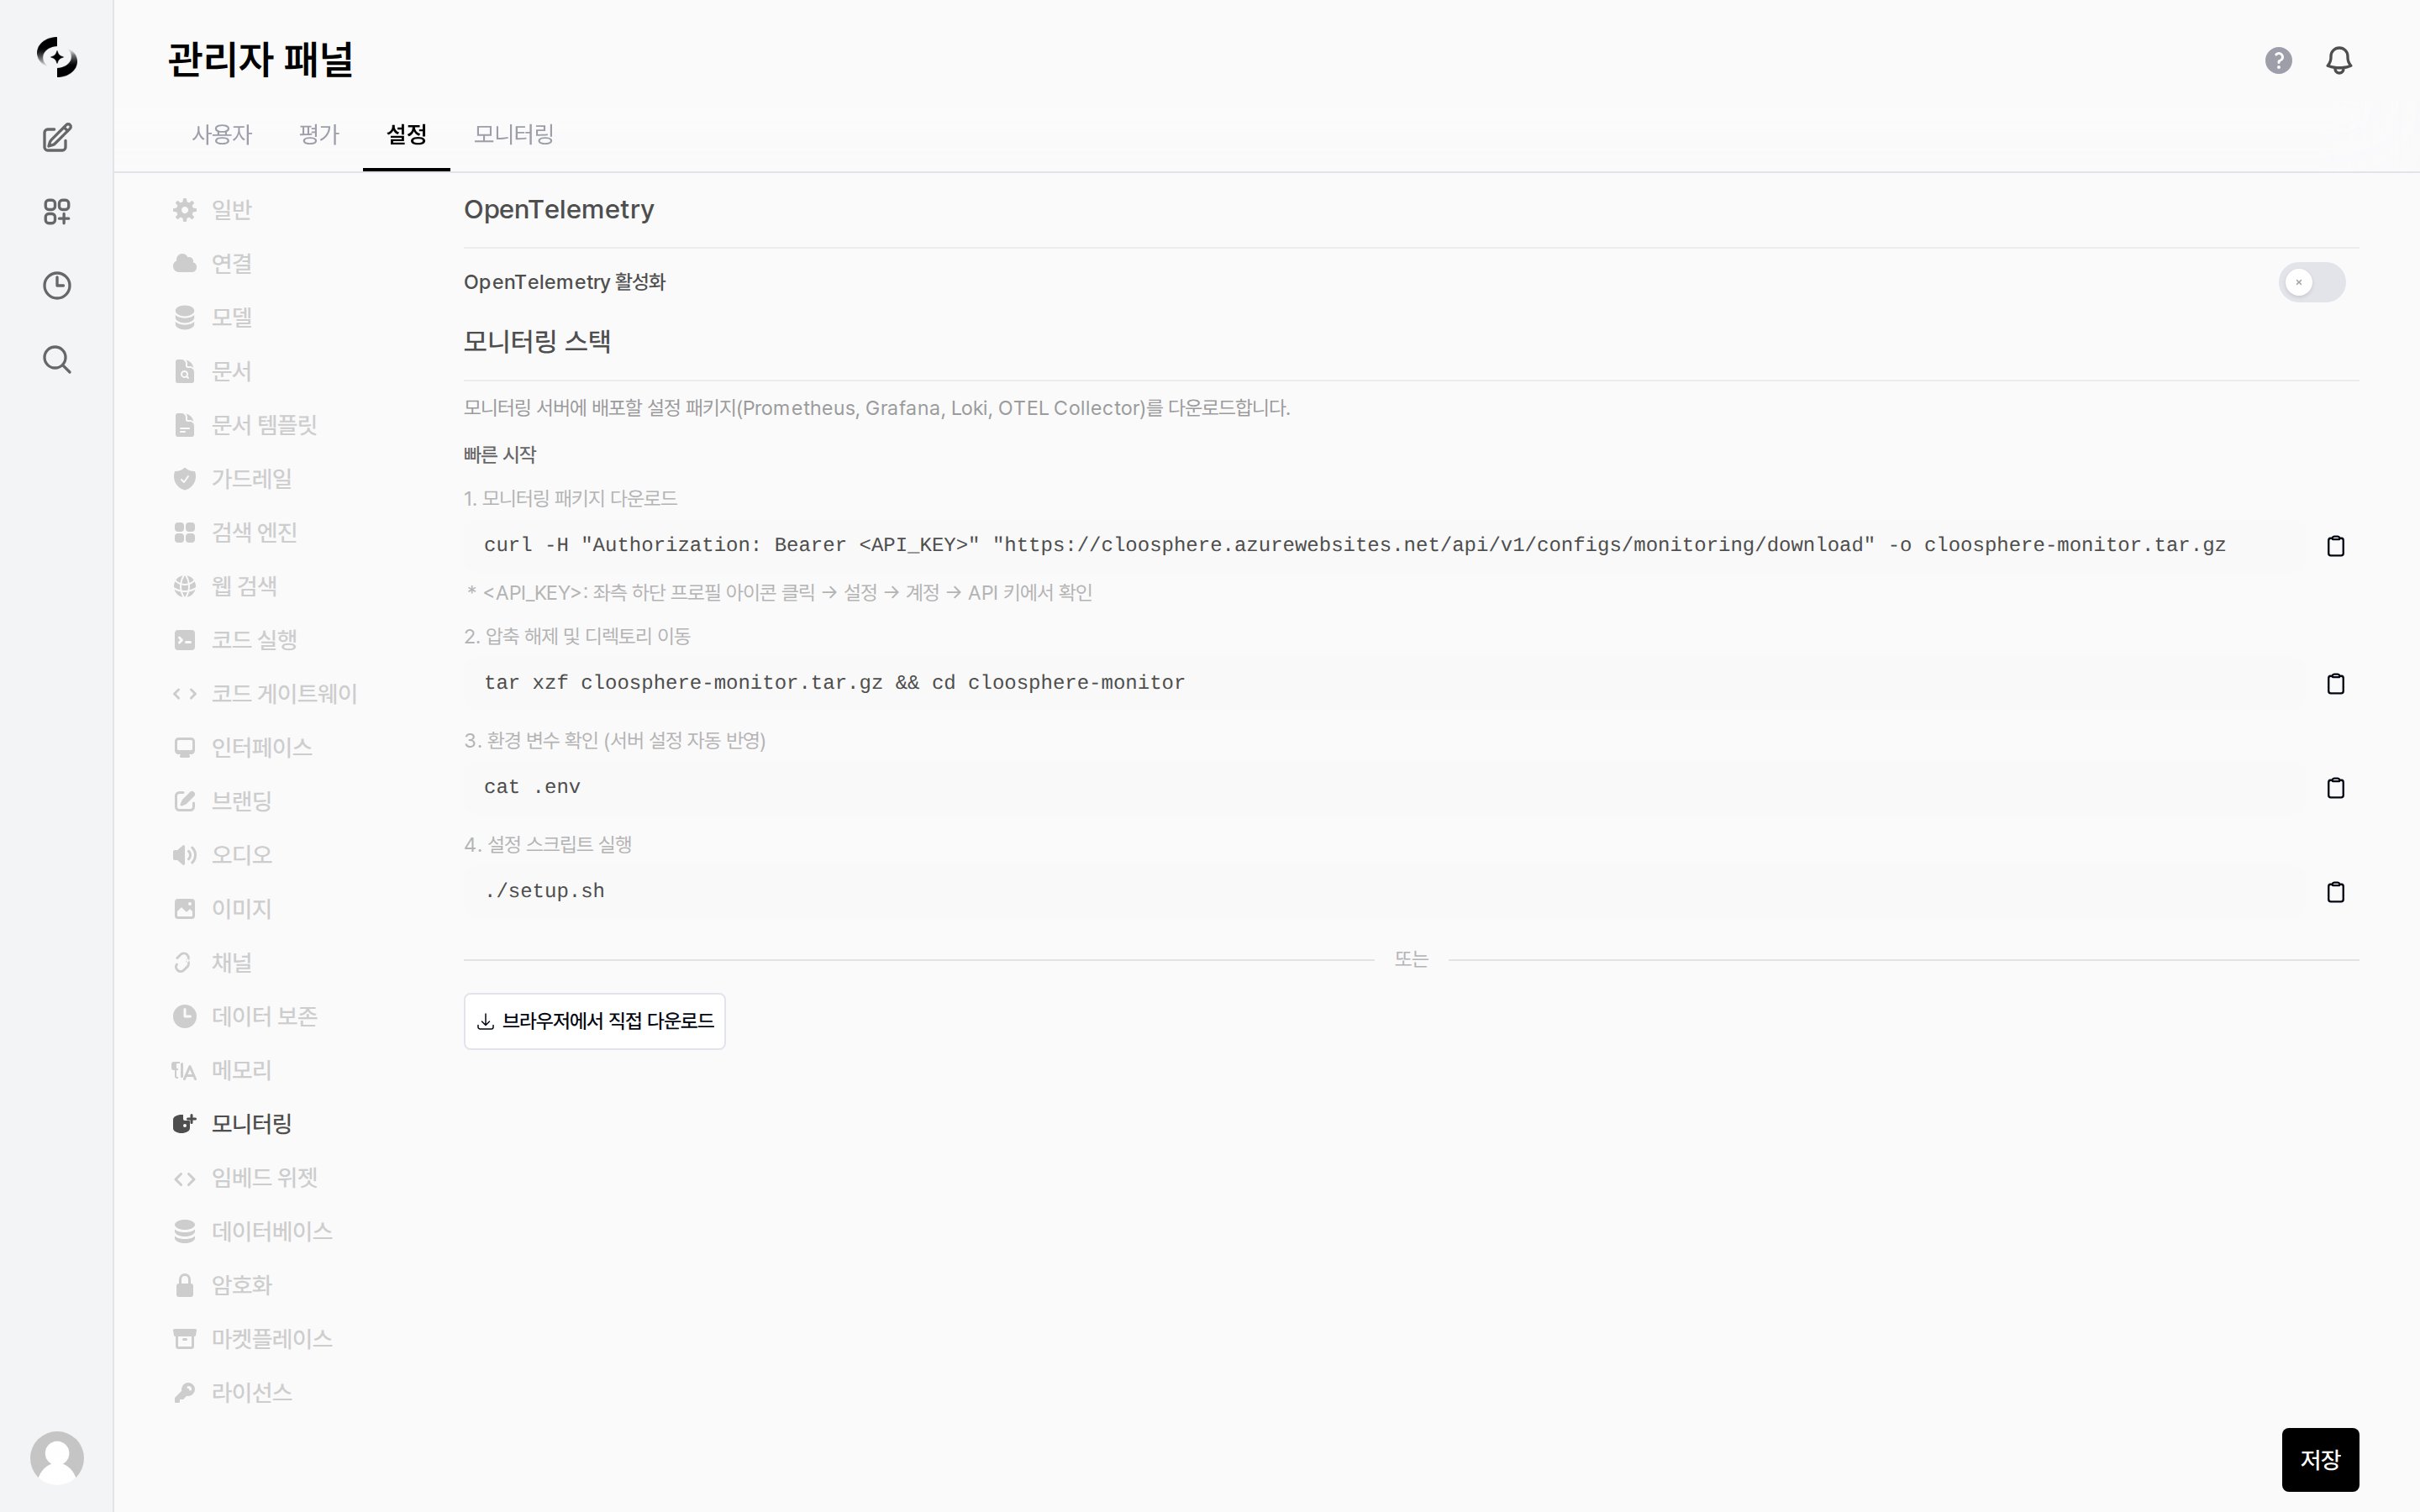
> Enable OpenTelemetry and download the external observability stack (Prometheus · Grafana · Loki) deployment package.
Admin › Settings › Monitoring
This page is for **external observability stack integration**. It differs from the [Monitoring tab](/en/monitoring/overview), where you view usage and logs directly in the UI.
Enabling OpenTelemetry (OTEL) lets you export Cloosphere's metrics, logs, and traces to an external monitoring stack.
* A deployment package composed of Prometheus, Grafana, Loki, and the OTEL Collector is provided.
 ***
## Enabling OpenTelemetry
Turning on the **Enable OpenTelemetry** toggle starts OTEL-based telemetry collection and export.
* Enabling it reveals the following settings.
| Setting | Description | Recommended / default |
| -------------------- | ------------------------------------------------------------------------------------------------------------------------------------------------------------------------------- | ----------------------- |
| **OTEL Endpoint** | Address of the OTEL Collector to export telemetry to. Use port `4318` (HTTP, recommended) or `4317` (gRPC); cloud environments such as Azure App Service require HTTP (`4318`). | `http://localhost:4318` |
| **Log Export Level** | Log level to export — `DEBUG` / `INFO` / `WARNING` / `ERROR` / `CRITICAL` | `WARNING` |
Changing a value in this section shows **"Changes will take effect after restarting the application."** on screen. Saving alone does not apply them — restart the server.
***
## Deploying the Monitoring Stack
Download and install the configuration package (Prometheus, Grafana, Loki, OTEL Collector) to deploy on your monitoring server.
```bash theme={null}
curl -H "Authorization: Bearer " \
"https:///api/v1/configs/monitoring/download" \
-o cloosphere-monitor.tar.gz
```
Find `` under **profile icon (bottom left) → Settings → Account → API Keys**. You can also use the **Download directly in browser** button on the screen.
```bash theme={null}
tar xzf cloosphere-monitor.tar.gz && cd cloosphere-monitor
```
```bash theme={null}
cat .env
```
Server settings are reflected automatically.
```bash theme={null}
./setup.sh
```
The **health endpoints** external monitoring polls (`/health/db`, `/health/redis`, `/health/full`) and multi-worker operational checks are covered in the [Deployment checklist](/en/admin/deployment-checklist).
***
## Enabling OpenTelemetry
Turning on the **Enable OpenTelemetry** toggle starts OTEL-based telemetry collection and export.
* Enabling it reveals the following settings.
| Setting | Description | Recommended / default |
| -------------------- | ------------------------------------------------------------------------------------------------------------------------------------------------------------------------------- | ----------------------- |
| **OTEL Endpoint** | Address of the OTEL Collector to export telemetry to. Use port `4318` (HTTP, recommended) or `4317` (gRPC); cloud environments such as Azure App Service require HTTP (`4318`). | `http://localhost:4318` |
| **Log Export Level** | Log level to export — `DEBUG` / `INFO` / `WARNING` / `ERROR` / `CRITICAL` | `WARNING` |
Changing a value in this section shows **"Changes will take effect after restarting the application."** on screen. Saving alone does not apply them — restart the server.
***
## Deploying the Monitoring Stack
Download and install the configuration package (Prometheus, Grafana, Loki, OTEL Collector) to deploy on your monitoring server.
```bash theme={null}
curl -H "Authorization: Bearer " \
"https:///api/v1/configs/monitoring/download" \
-o cloosphere-monitor.tar.gz
```
Find `` under **profile icon (bottom left) → Settings → Account → API Keys**. You can also use the **Download directly in browser** button on the screen.
```bash theme={null}
tar xzf cloosphere-monitor.tar.gz && cd cloosphere-monitor
```
```bash theme={null}
cat .env
```
Server settings are reflected automatically.
```bash theme={null}
./setup.sh
```
The **health endpoints** external monitoring polls (`/health/db`, `/health/redis`, `/health/full`) and multi-worker operational checks are covered in the [Deployment checklist](/en/admin/deployment-checklist).