> ## Documentation Index
> Fetch the complete documentation index at: https://docs.cloosphere.ai/llms.txt
> Use this file to discover all available pages before exploring further.
# Conversation Logs
> View individual conversations (requests) and their token usage per request, broken down by user, agent, and model.
Admin › Monitoring › Conversation Logs
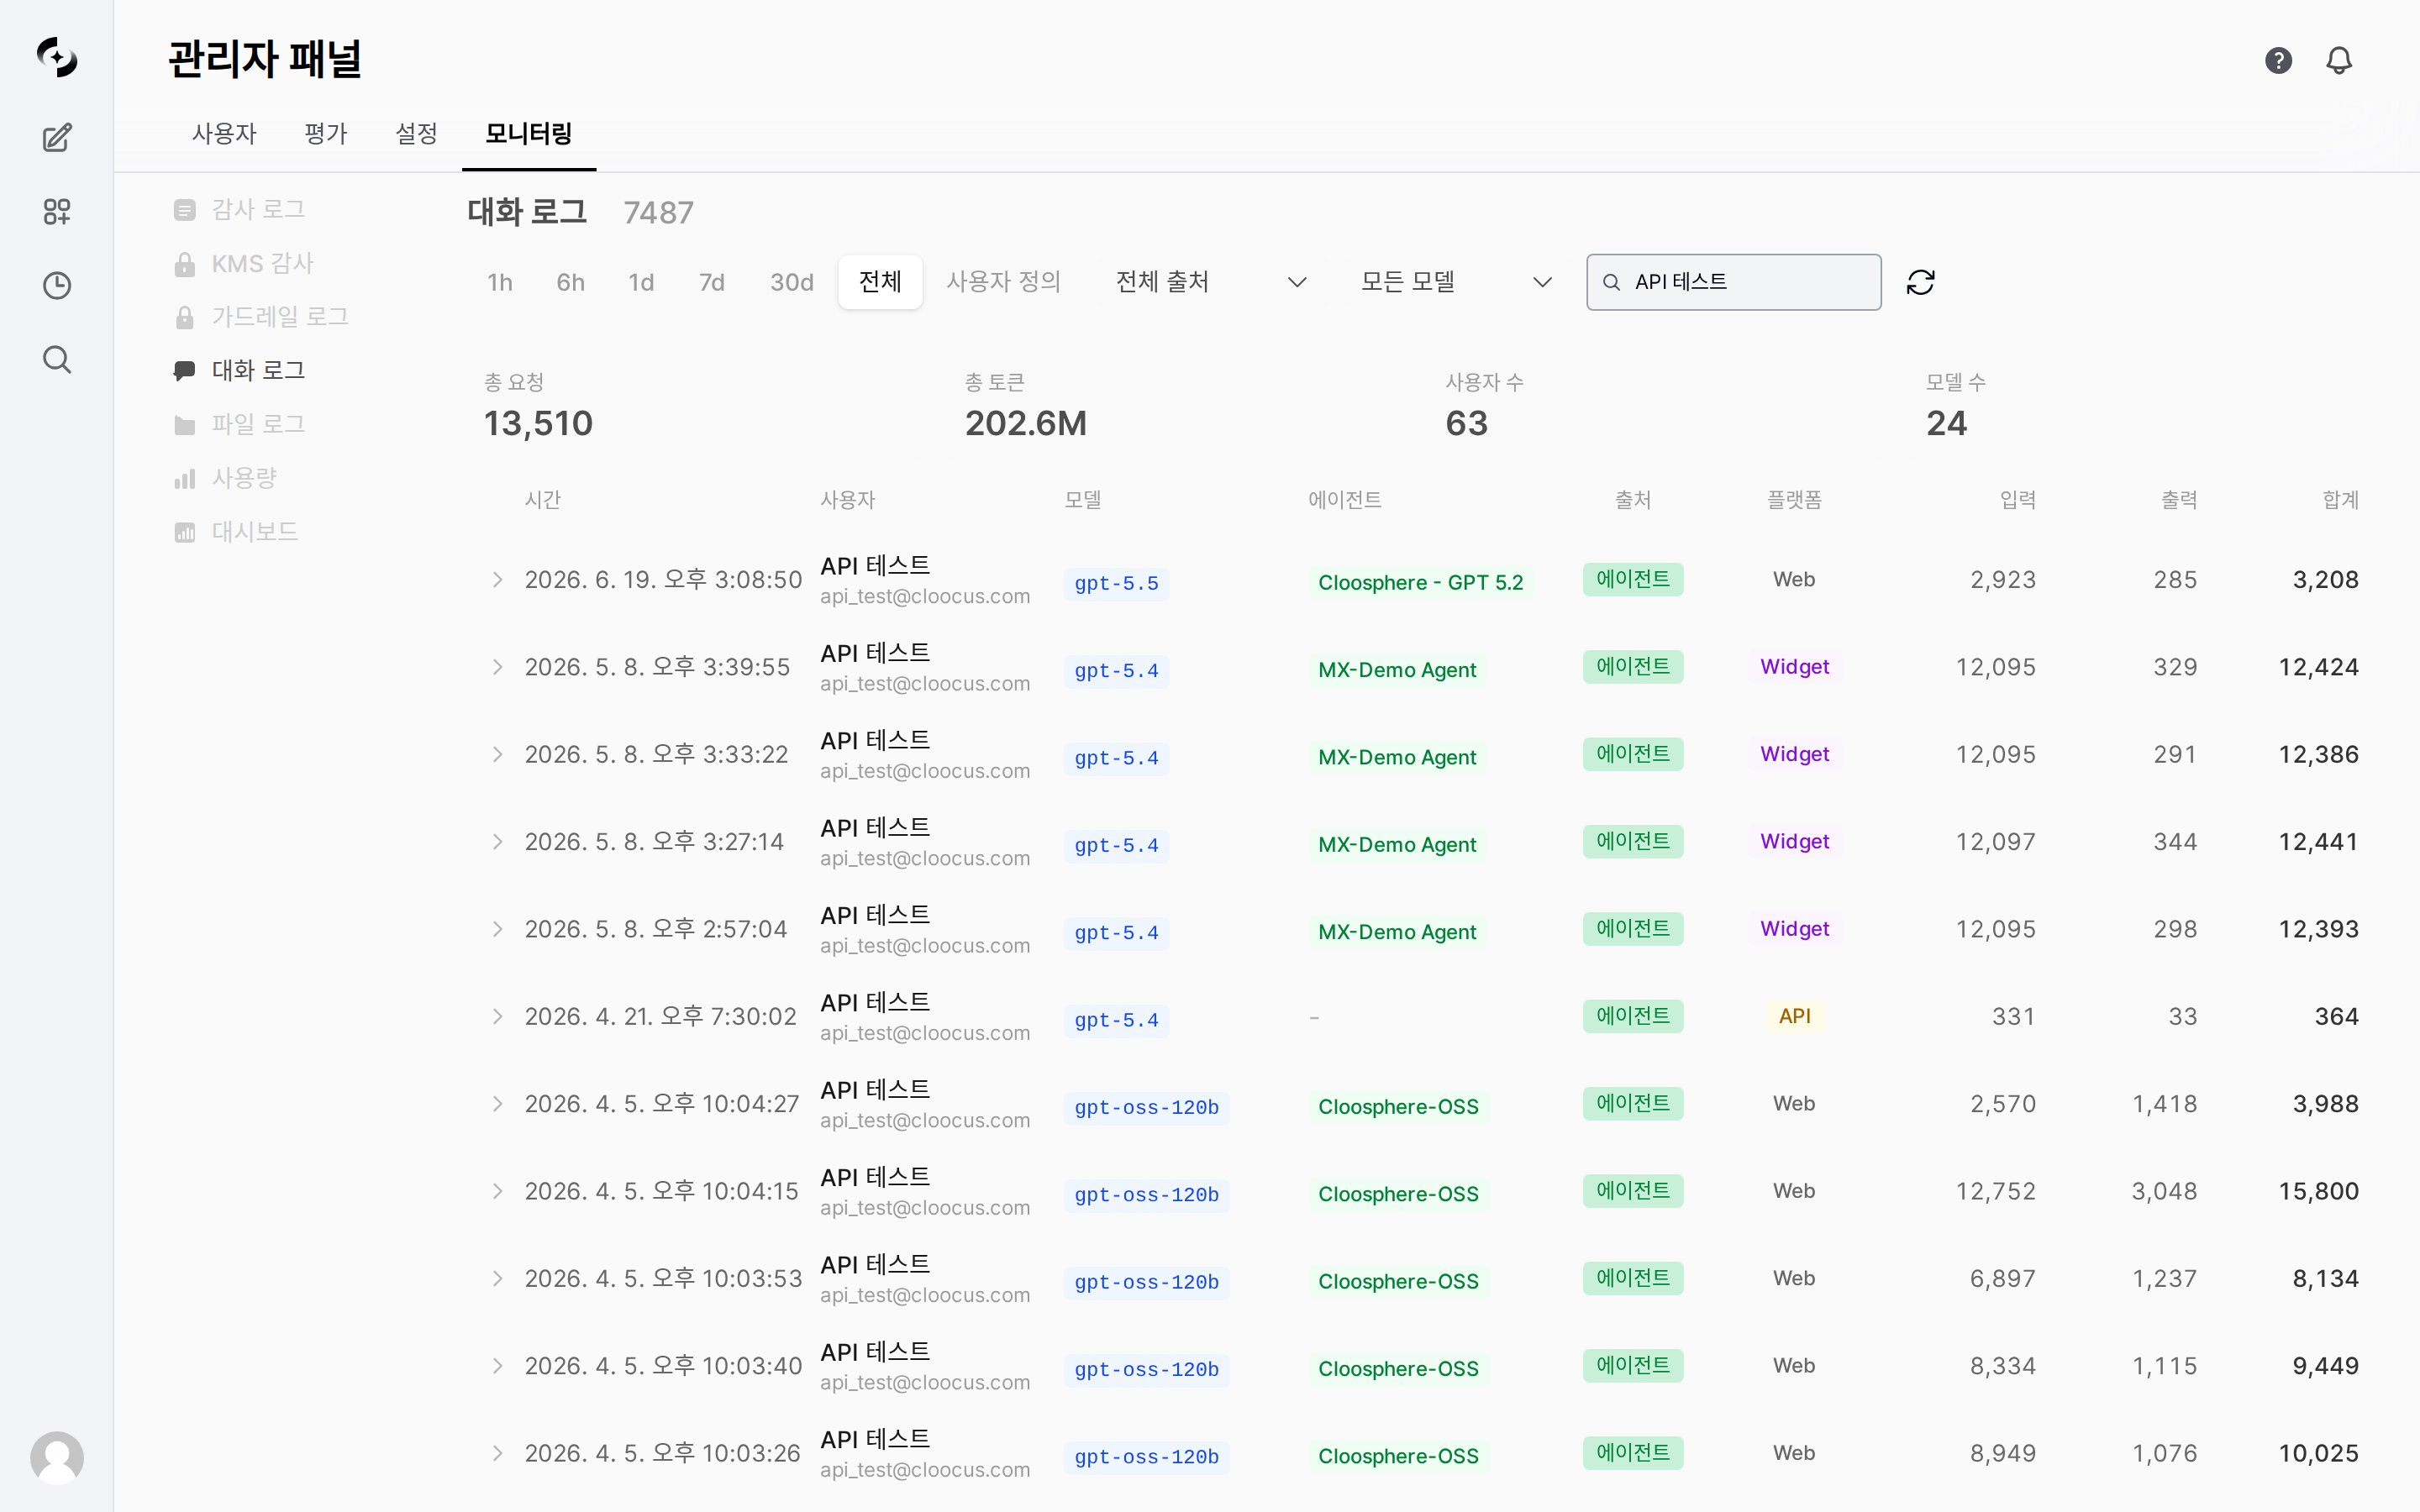
Conversation Logs are records that **lay out each individual conversation (request) as a single row** as it happened in the system.
Where [Usage](/en/monitoring/usage) **aggregates and summarizes** tokens and cost, Conversation Logs let you inspect *"who · which agent/model · when · how many tokens"* at the level of **a single request**.
They are the **source rows** behind the numbers you see in the usage charts.
 Conversation Logs include **actual user names and emails**. Only admins with access permission can view them.
***
## Statistics Summary
The top of the screen shows aggregate cards based on the **current period and filters**.
| Metric | Meaning |
| ------------------ | ------------------------------------------ |
| **Total requests** | Number of requests matching the conditions |
| **Total tokens** | Sum of input + output tokens |
| **User count** | Number of distinct users who made requests |
| **Model count** | Number of distinct models used |
***
## Log Entry Structure
Each row is **a single request**. The table consists of the following columns.
| Column | Description |
| ------------ | ---------------------------------------------------------------------------------- |
| **Time** | When the request occurred |
| **User** | Requesting user (name, email) |
| **Model** | Model used for the response (e.g., `google/gemini-3-flash-preview`) |
| **Agent** | Agent the request went through (when applicable) |
| **Source** | Request source type — general chat (Chat), agent (Agent), code gateway (Code), API |
| **Platform** | Client the request came from (e.g., `Web`) |
| **Input** | Input (prompt) tokens |
| **Output** | Output (response) tokens |
| **Total** | Sum of input + output tokens |
***
## Filtering and Viewing
| Filter | Description |
| ---------- | ----------------------------------------------------------------------------------- |
| **Period** | Shared period bar at the top — `1h` / `6h` / `1d` / `7d` / `30d` / `All` / `Custom` |
| **Source** | `All sources` or only a specific source (general chat · agent · code gateway · API) |
| **Model** | `All models` or only a specific model |
| **User** | Search and select by user name |
Only items that **actually have conversation records** appear as candidates in the source, model, and user filters.
If there are many rows, navigate pages at the bottom (default 50 per page).
***
## Difference from Usage
Conversation Logs view the same token data as [Usage](/en/monitoring/usage), but the **unit** you look at differs.
| Aspect | Usage | Conversation Logs |
| ------------ | ----------------------------------------------- | --------------------------------------------------------------- |
| **Unit** | **Aggregated** by period, model, user | **A single** request |
| **Form** | Charts, totals | Row-level table |
| **Main use** | Token/cost trends, identifying top users/models | Tracing individual requests of a specific user, model, or agent |
When you spot an anomaly in Usage (e.g., a token spike for a specific user or model), you filter Conversation Logs by the same user or model to **drill down to the source request level** and check — they're used together in that flow.
***
## Use Cases
1. Enter a name in the **User** filter to view only that user
2. Narrow the **Period** to find requests at the point you want to check
3. Use **Model, Agent, and Total tokens** to identify which requests consumed the most tokens
1. Select a high-priced model with the **Model** filter
2. Look at rows with large **Total** tokens to find token-heavy requests
3. Compare against the overall trend for the same model in [Usage](/en/monitoring/usage)
1. Use the **Source** filter to see only agent or code gateway requests
2. Use the **Agent** column to check which agents are called
3. Use the **Platform** column to see which client the requests come from
***
## Related Logs
* **Aggregate trends**: [Usage](/en/monitoring/usage) — summarizes tokens and cost by period, model, and user
* **Activity audit**: [Audit Logs](/en/monitoring/audit-logs) — records resource changes, sign-ins, and other activity
* **Retention period**: Accumulated logs are cleaned up per the [Data Retention](/en/admin/settings/data-retention) setting
Conversation Logs include **actual user names and emails**. Only admins with access permission can view them.
***
## Statistics Summary
The top of the screen shows aggregate cards based on the **current period and filters**.
| Metric | Meaning |
| ------------------ | ------------------------------------------ |
| **Total requests** | Number of requests matching the conditions |
| **Total tokens** | Sum of input + output tokens |
| **User count** | Number of distinct users who made requests |
| **Model count** | Number of distinct models used |
***
## Log Entry Structure
Each row is **a single request**. The table consists of the following columns.
| Column | Description |
| ------------ | ---------------------------------------------------------------------------------- |
| **Time** | When the request occurred |
| **User** | Requesting user (name, email) |
| **Model** | Model used for the response (e.g., `google/gemini-3-flash-preview`) |
| **Agent** | Agent the request went through (when applicable) |
| **Source** | Request source type — general chat (Chat), agent (Agent), code gateway (Code), API |
| **Platform** | Client the request came from (e.g., `Web`) |
| **Input** | Input (prompt) tokens |
| **Output** | Output (response) tokens |
| **Total** | Sum of input + output tokens |
***
## Filtering and Viewing
| Filter | Description |
| ---------- | ----------------------------------------------------------------------------------- |
| **Period** | Shared period bar at the top — `1h` / `6h` / `1d` / `7d` / `30d` / `All` / `Custom` |
| **Source** | `All sources` or only a specific source (general chat · agent · code gateway · API) |
| **Model** | `All models` or only a specific model |
| **User** | Search and select by user name |
Only items that **actually have conversation records** appear as candidates in the source, model, and user filters.
If there are many rows, navigate pages at the bottom (default 50 per page).
***
## Difference from Usage
Conversation Logs view the same token data as [Usage](/en/monitoring/usage), but the **unit** you look at differs.
| Aspect | Usage | Conversation Logs |
| ------------ | ----------------------------------------------- | --------------------------------------------------------------- |
| **Unit** | **Aggregated** by period, model, user | **A single** request |
| **Form** | Charts, totals | Row-level table |
| **Main use** | Token/cost trends, identifying top users/models | Tracing individual requests of a specific user, model, or agent |
When you spot an anomaly in Usage (e.g., a token spike for a specific user or model), you filter Conversation Logs by the same user or model to **drill down to the source request level** and check — they're used together in that flow.
***
## Use Cases
1. Enter a name in the **User** filter to view only that user
2. Narrow the **Period** to find requests at the point you want to check
3. Use **Model, Agent, and Total tokens** to identify which requests consumed the most tokens
1. Select a high-priced model with the **Model** filter
2. Look at rows with large **Total** tokens to find token-heavy requests
3. Compare against the overall trend for the same model in [Usage](/en/monitoring/usage)
1. Use the **Source** filter to see only agent or code gateway requests
2. Use the **Agent** column to check which agents are called
3. Use the **Platform** column to see which client the requests come from
***
## Related Logs
* **Aggregate trends**: [Usage](/en/monitoring/usage) — summarizes tokens and cost by period, model, and user
* **Activity audit**: [Audit Logs](/en/monitoring/audit-logs) — records resource changes, sign-ins, and other activity
* **Retention period**: Accumulated logs are cleaned up per the [Data Retention](/en/admin/settings/data-retention) setting