> ## Documentation Index
> Fetch the complete documentation index at: https://docs.cloosphere.ai/llms.txt
> Use this file to discover all available pages before exploring further.
# Dashboard
> AI-based panel dashboard — auto-generate SQL charts from natural language, share, and export
Admin › Monitoring › Dashboard
The Dashboard auto-generates SQL charts from **a single natural language line**.
* Add and edit panels by chatting with the AI assistant, then share the completed dashboard with your team or export to HTML.
| Method | Process | Time |
| --------- | ------------------------------------------------ | :-------------: |
| Manual | Write SQL → execute → Excel chart → slide | 30 min \~ hours |
| Dashboard | Natural language input → AI auto-generates chart | **30 sec** |
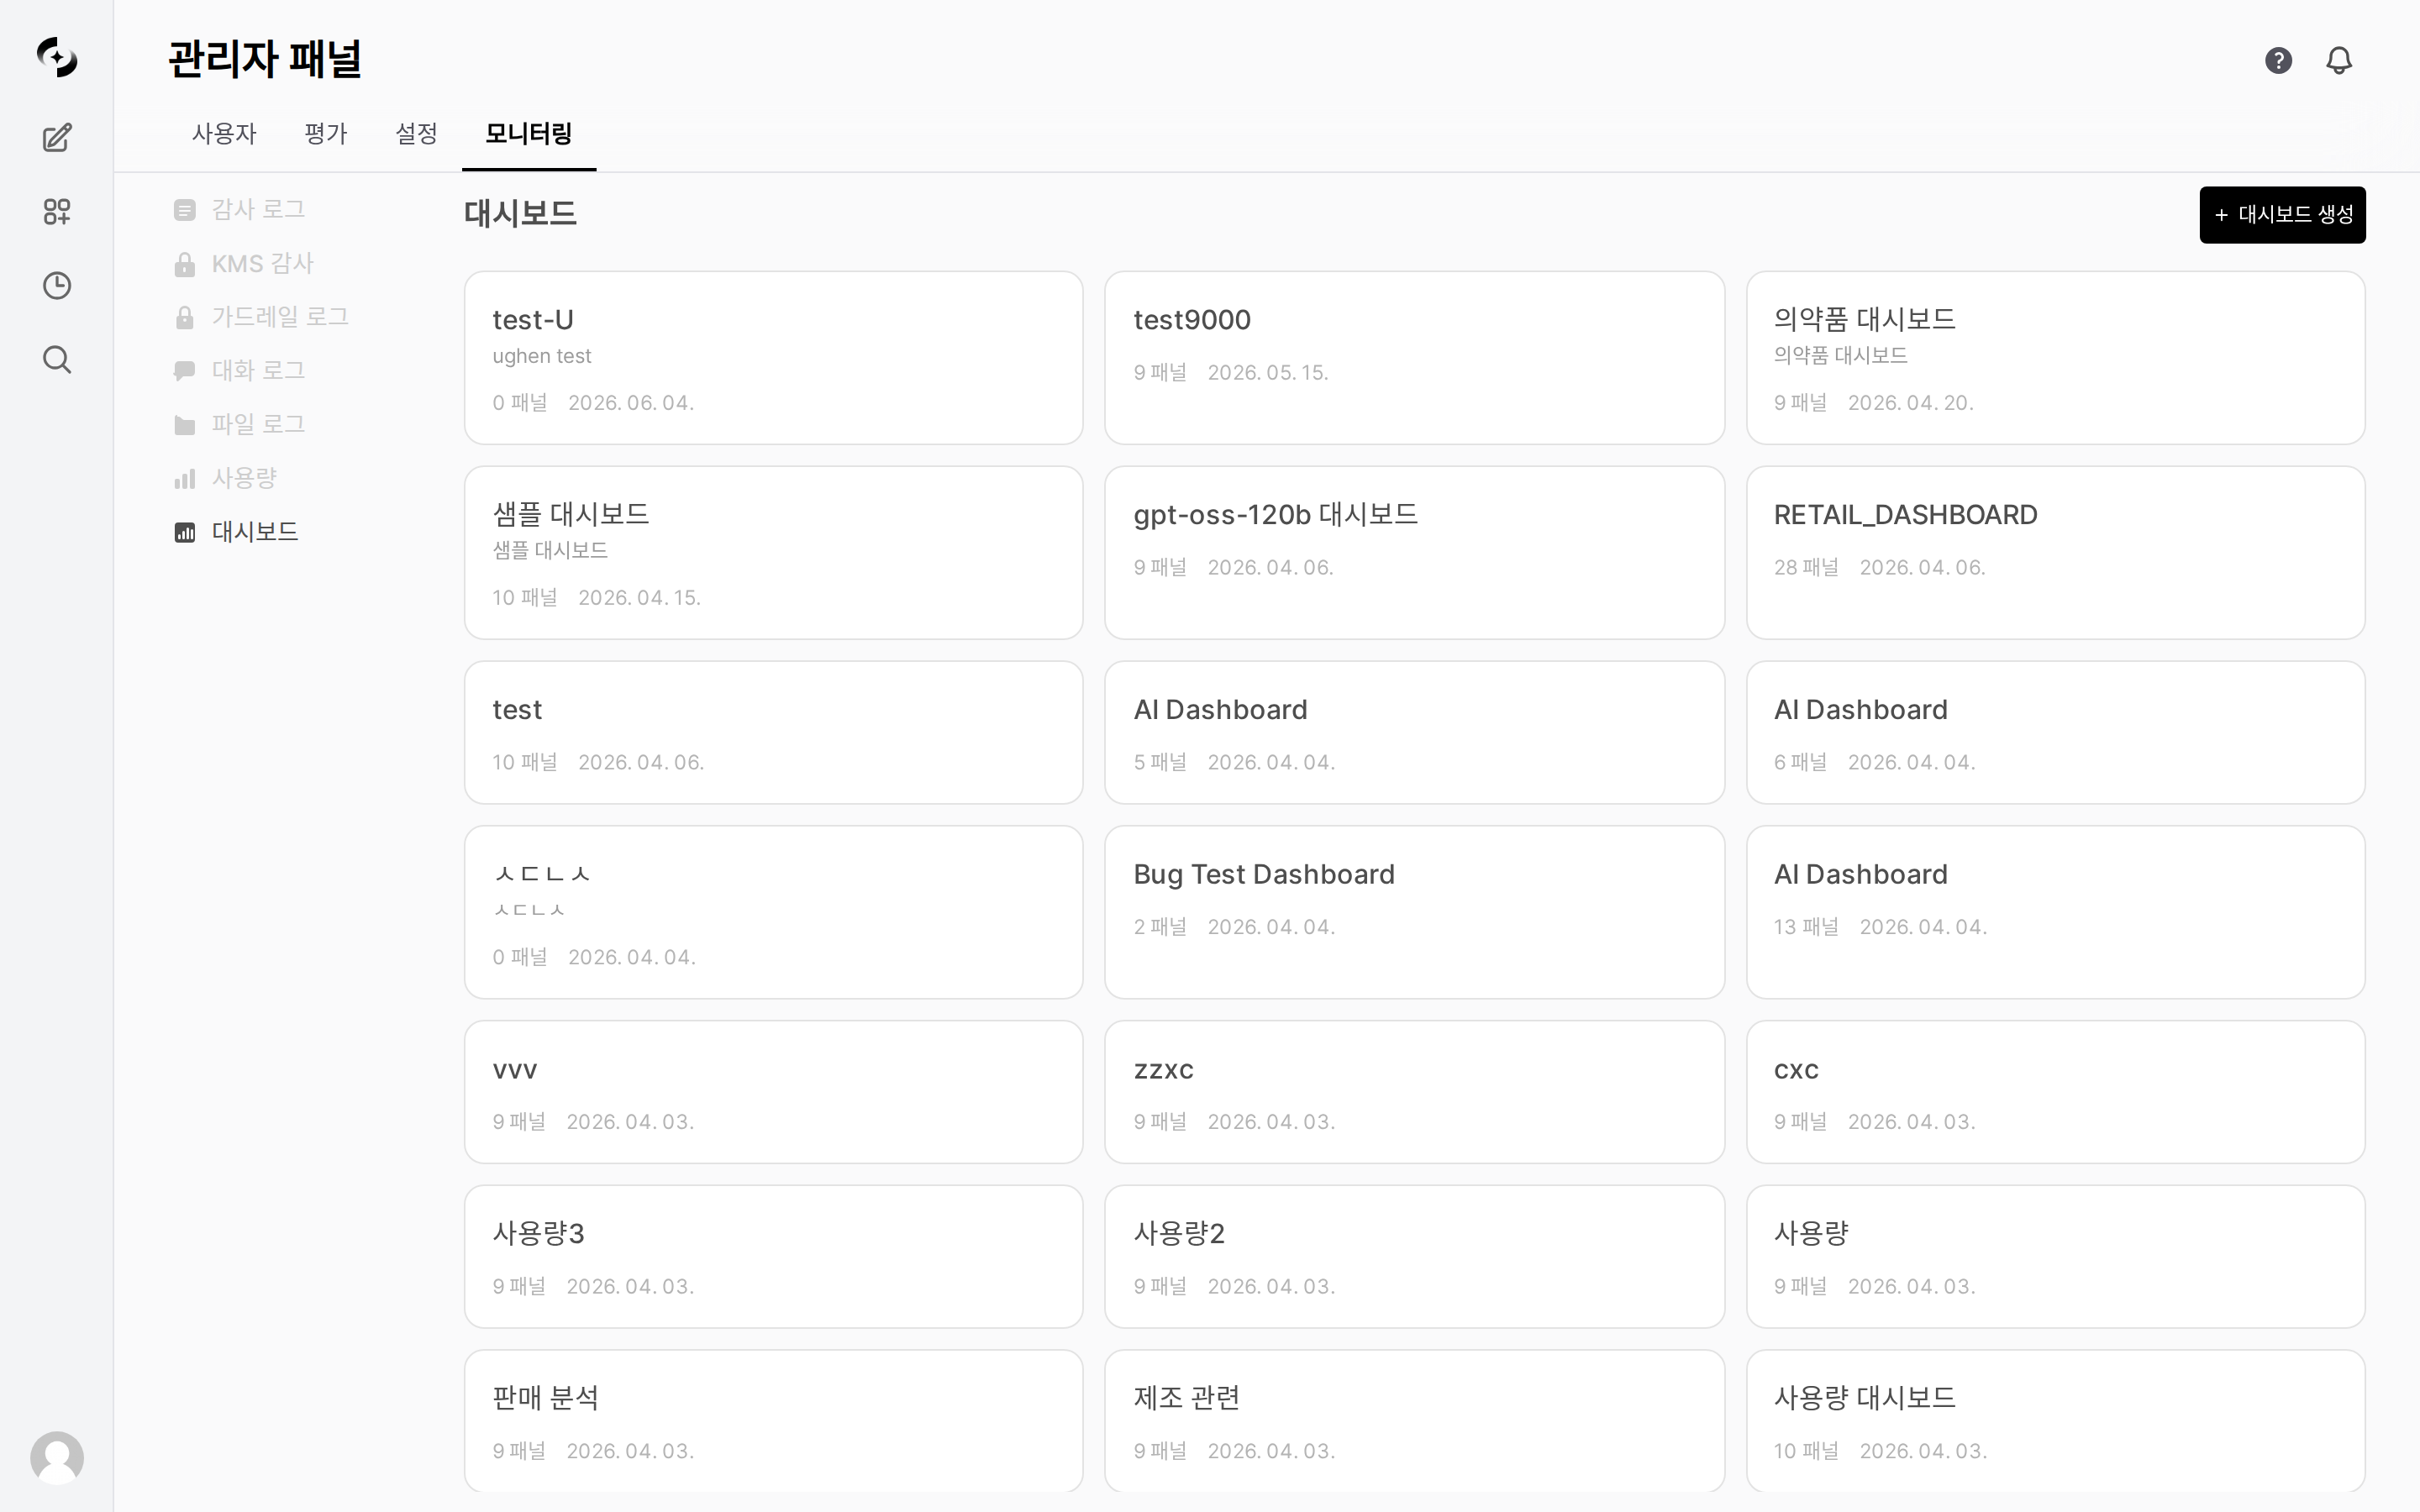 ## Access Path
| Permission | Dashboard List | Create/Edit/Delete | Shared Dashboards |
| ------------------------ | :------------------------: | :----------------: | :---------------: |
| Admin (monitoring write) | All | ✓ | ✓ |
| Admin (monitoring read) | All | ✗ | ✓ |
| Regular user | Owned + public/shared only | ✗ | ✓ |
***
## Creating Dashboards
Click **Create Dashboard** in the dashboard list.
| Field | Required | Description |
| --------------- | :------: | ------------------------------------------- |
| **Name** | ✓ | Dashboard name (must be unique system-wide) |
| **Description** | ✗ | Dashboard purpose |
DB connection isn't configured at this stage. Different DBs can be used per panel, so DB is selected when adding panels.
From the created dashboard, add panels via **Add Panel** or **AI Assistant**. In the add-panel modal, first choose the **Chart / Card** type.
Visualize SQL execution results as various charts. Enter a **natural language question** in the panel editor and AI auto-generates SQL.
## Access Path
| Permission | Dashboard List | Create/Edit/Delete | Shared Dashboards |
| ------------------------ | :------------------------: | :----------------: | :---------------: |
| Admin (monitoring write) | All | ✓ | ✓ |
| Admin (monitoring read) | All | ✗ | ✓ |
| Regular user | Owned + public/shared only | ✗ | ✓ |
***
## Creating Dashboards
Click **Create Dashboard** in the dashboard list.
| Field | Required | Description |
| --------------- | :------: | ------------------------------------------- |
| **Name** | ✓ | Dashboard name (must be unique system-wide) |
| **Description** | ✗ | Dashboard purpose |
DB connection isn't configured at this stage. Different DBs can be used per panel, so DB is selected when adding panels.
From the created dashboard, add panels via **Add Panel** or **AI Assistant**. In the add-panel modal, first choose the **Chart / Card** type.
Visualize SQL execution results as various charts. Enter a **natural language question** in the panel editor and AI auto-generates SQL.
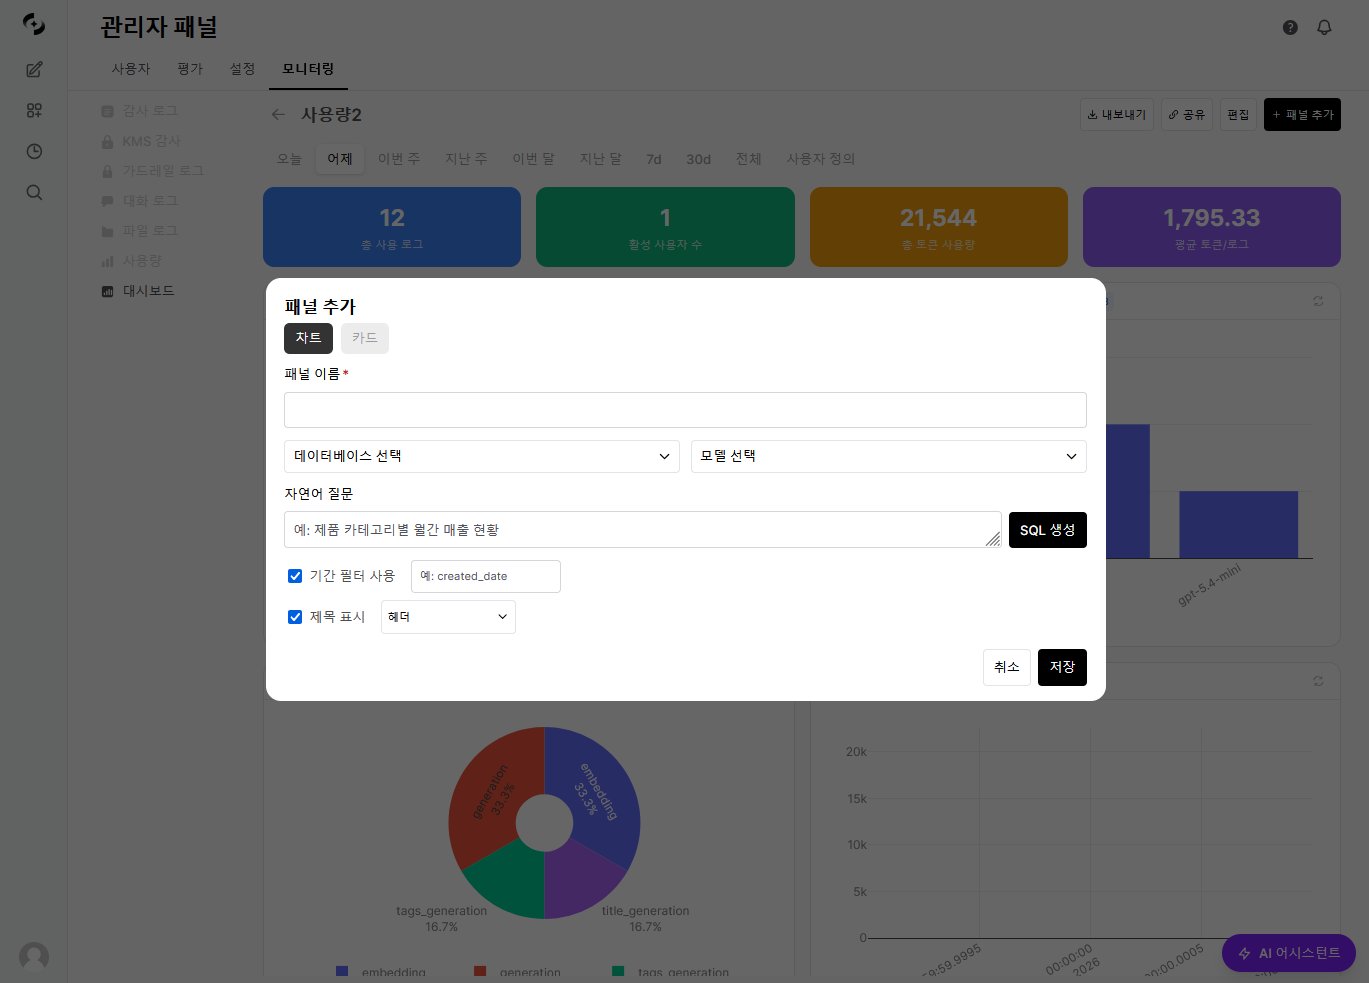 **Supported chart types:**
| Chart | Description | Use Case |
| --------------- | --------------------------------- | --------------------------------------- |
| **Table** | Display data in table form | Detailed data viewing |
| **Bar** | Per-item comparison | Per-model usage count |
| **Grouped Bar** | Compare multiple grouped series | Per-model · per-period cost comparison |
| **Line** | Trend over time | Daily token usage trend |
| **Area** | Trend + area emphasis | Cumulative usage change |
| **Pie** | Ratio distribution | Per-agent usage share |
| **Scatter** | Correlation between two variables | Response time vs. token count |
| **Histogram** | Numeric distribution | Response time distribution |
| **Heatmap** | 2D matrix value distribution | Per-time-of-day · per-day-of-week usage |
Click the chart-type icon at the top of the panel in edit mode for instant switching.
A summary card showing key KPI values at a glance.
**Supported chart types:**
| Chart | Description | Use Case |
| --------------- | --------------------------------- | --------------------------------------- |
| **Table** | Display data in table form | Detailed data viewing |
| **Bar** | Per-item comparison | Per-model usage count |
| **Grouped Bar** | Compare multiple grouped series | Per-model · per-period cost comparison |
| **Line** | Trend over time | Daily token usage trend |
| **Area** | Trend + area emphasis | Cumulative usage change |
| **Pie** | Ratio distribution | Per-agent usage share |
| **Scatter** | Correlation between two variables | Response time vs. token count |
| **Histogram** | Numeric distribution | Response time distribution |
| **Heatmap** | 2D matrix value distribution | Per-time-of-day · per-day-of-week usage |
Click the chart-type icon at the top of the panel in edit mode for instant switching.
A summary card showing key KPI values at a glance.
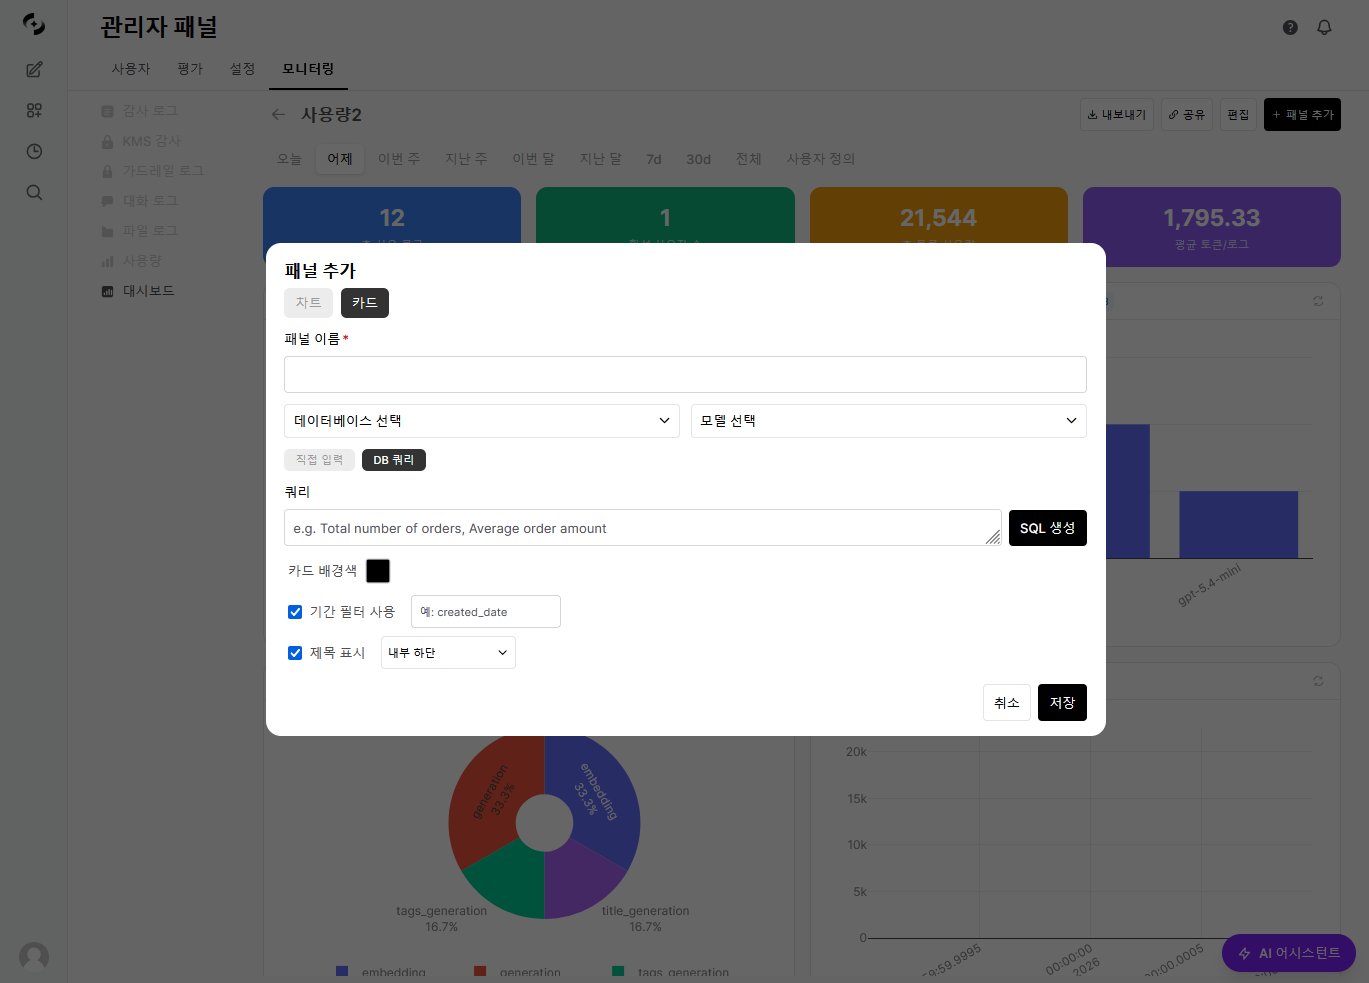 | Source | Description |
| ---------------- | ---------------------------------------------------- |
| **Manual Input** | Direct fixed value entry (e.g., "1,234" or "Active") |
| **DB Query** | Real-time value lookup via natural language → SQL |
Specify a background color for visual distinction.
Then configure SQL and period filters in the [Panel Editor](#panel-editor); for conversational creation, see [AI Assistant](#ai-assistant).
In **Edit** mode, drag panels to move them and use the bottom-right handle to resize. Layout is on a 12-column grid.
***
## Panel Composition
A dashboard consists of individual **panels**.
* Each panel has its own DB connection and SQL.
* For panel type (chart · card) selection, see the [Add panels](#creating-dashboards) step.
| Source | Description |
| ---------------- | ---------------------------------------------------- |
| **Manual Input** | Direct fixed value entry (e.g., "1,234" or "Active") |
| **DB Query** | Real-time value lookup via natural language → SQL |
Specify a background color for visual distinction.
Then configure SQL and period filters in the [Panel Editor](#panel-editor); for conversational creation, see [AI Assistant](#ai-assistant).
In **Edit** mode, drag panels to move them and use the bottom-right handle to resize. Layout is on a 12-column grid.
***
## Panel Composition
A dashboard consists of individual **panels**.
* Each panel has its own DB connection and SQL.
* For panel type (chart · card) selection, see the [Add panels](#creating-dashboards) step.
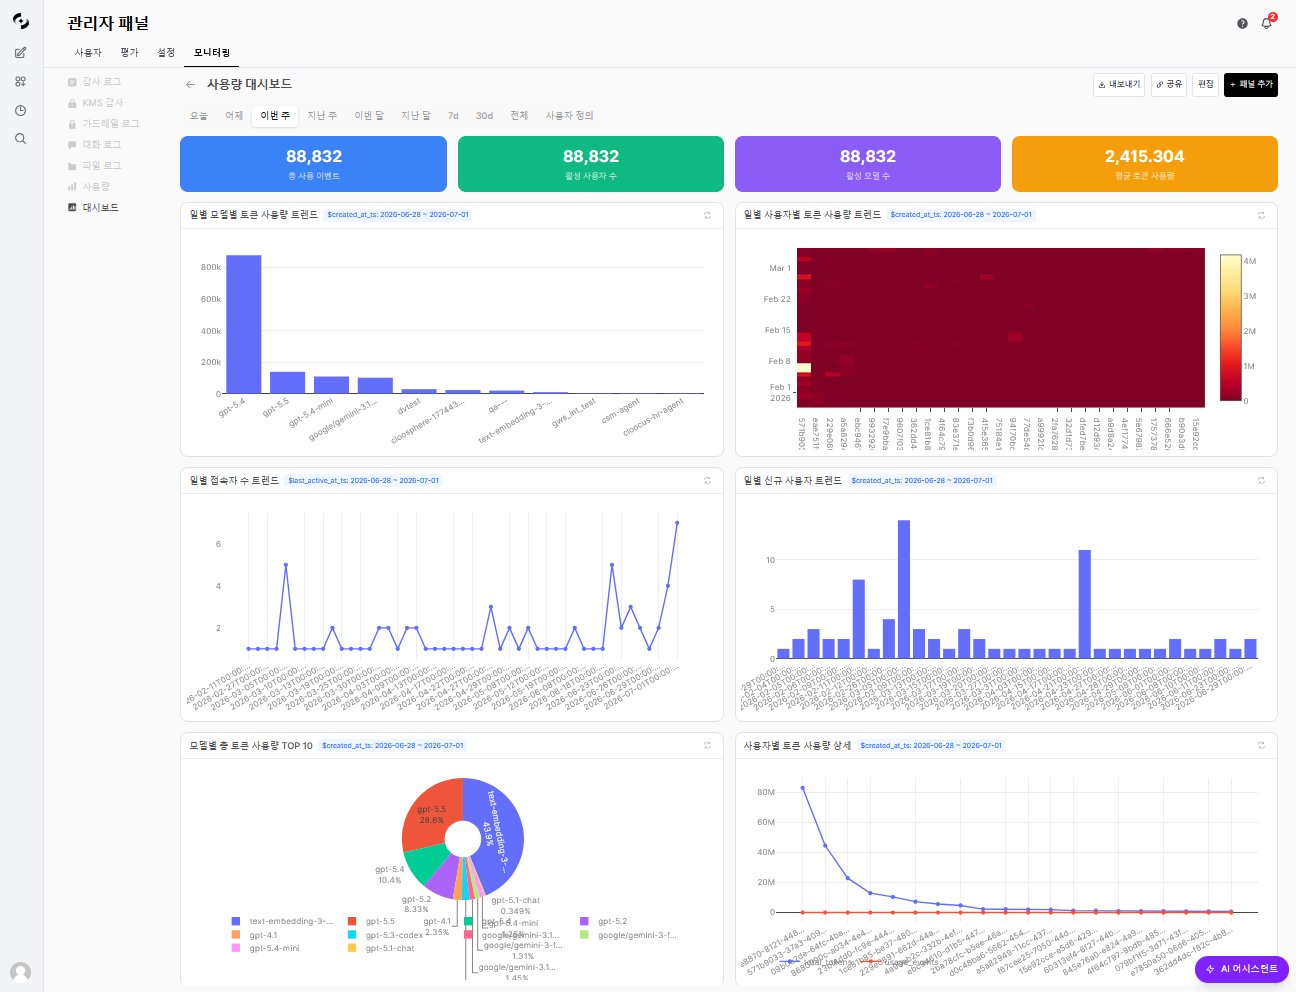 ### Panel Editor
Click **Add Panel** or the edit icon on an existing panel to open the panel edit modal.
| Field | Description |
| ----------------------------- | ------------------------------------------------------------------------------------------------ |
| **Panel name** | Panel title (required) |
| **Database selection** | Pick the DbSphere to connect |
| **Model selection** | AI model used for SQL generation |
| **Natural language question** | Describe the data you want in natural language |
| **Generate SQL** | AI auto-converts the natural language question to SQL (the generated SQL can be edited directly) |
| **Use period filter** | Specify date column to integrate with the dashboard period filter |
| **Title display** | Choose where the panel title appears (header / inside bottom) |
The generated SQL can be edited freely. If the AI-generated SQL isn't accurate, just edit it directly.
***
## AI Assistant
Click the **purple AI Assistant button at the bottom-right** of the dashboard to open a chat panel at the bottom.
* Pick a **model** at the top and describe what you want in natural language.
* When starting out, click one of the suggested prompts to begin right away.
### Panel Editor
Click **Add Panel** or the edit icon on an existing panel to open the panel edit modal.
| Field | Description |
| ----------------------------- | ------------------------------------------------------------------------------------------------ |
| **Panel name** | Panel title (required) |
| **Database selection** | Pick the DbSphere to connect |
| **Model selection** | AI model used for SQL generation |
| **Natural language question** | Describe the data you want in natural language |
| **Generate SQL** | AI auto-converts the natural language question to SQL (the generated SQL can be edited directly) |
| **Use period filter** | Specify date column to integrate with the dashboard period filter |
| **Title display** | Choose where the panel title appears (header / inside bottom) |
The generated SQL can be edited freely. If the AI-generated SQL isn't accurate, just edit it directly.
***
## AI Assistant
Click the **purple AI Assistant button at the bottom-right** of the dashboard to open a chat panel at the bottom.
* Pick a **model** at the top and describe what you want in natural language.
* When starting out, click one of the suggested prompts to begin right away.
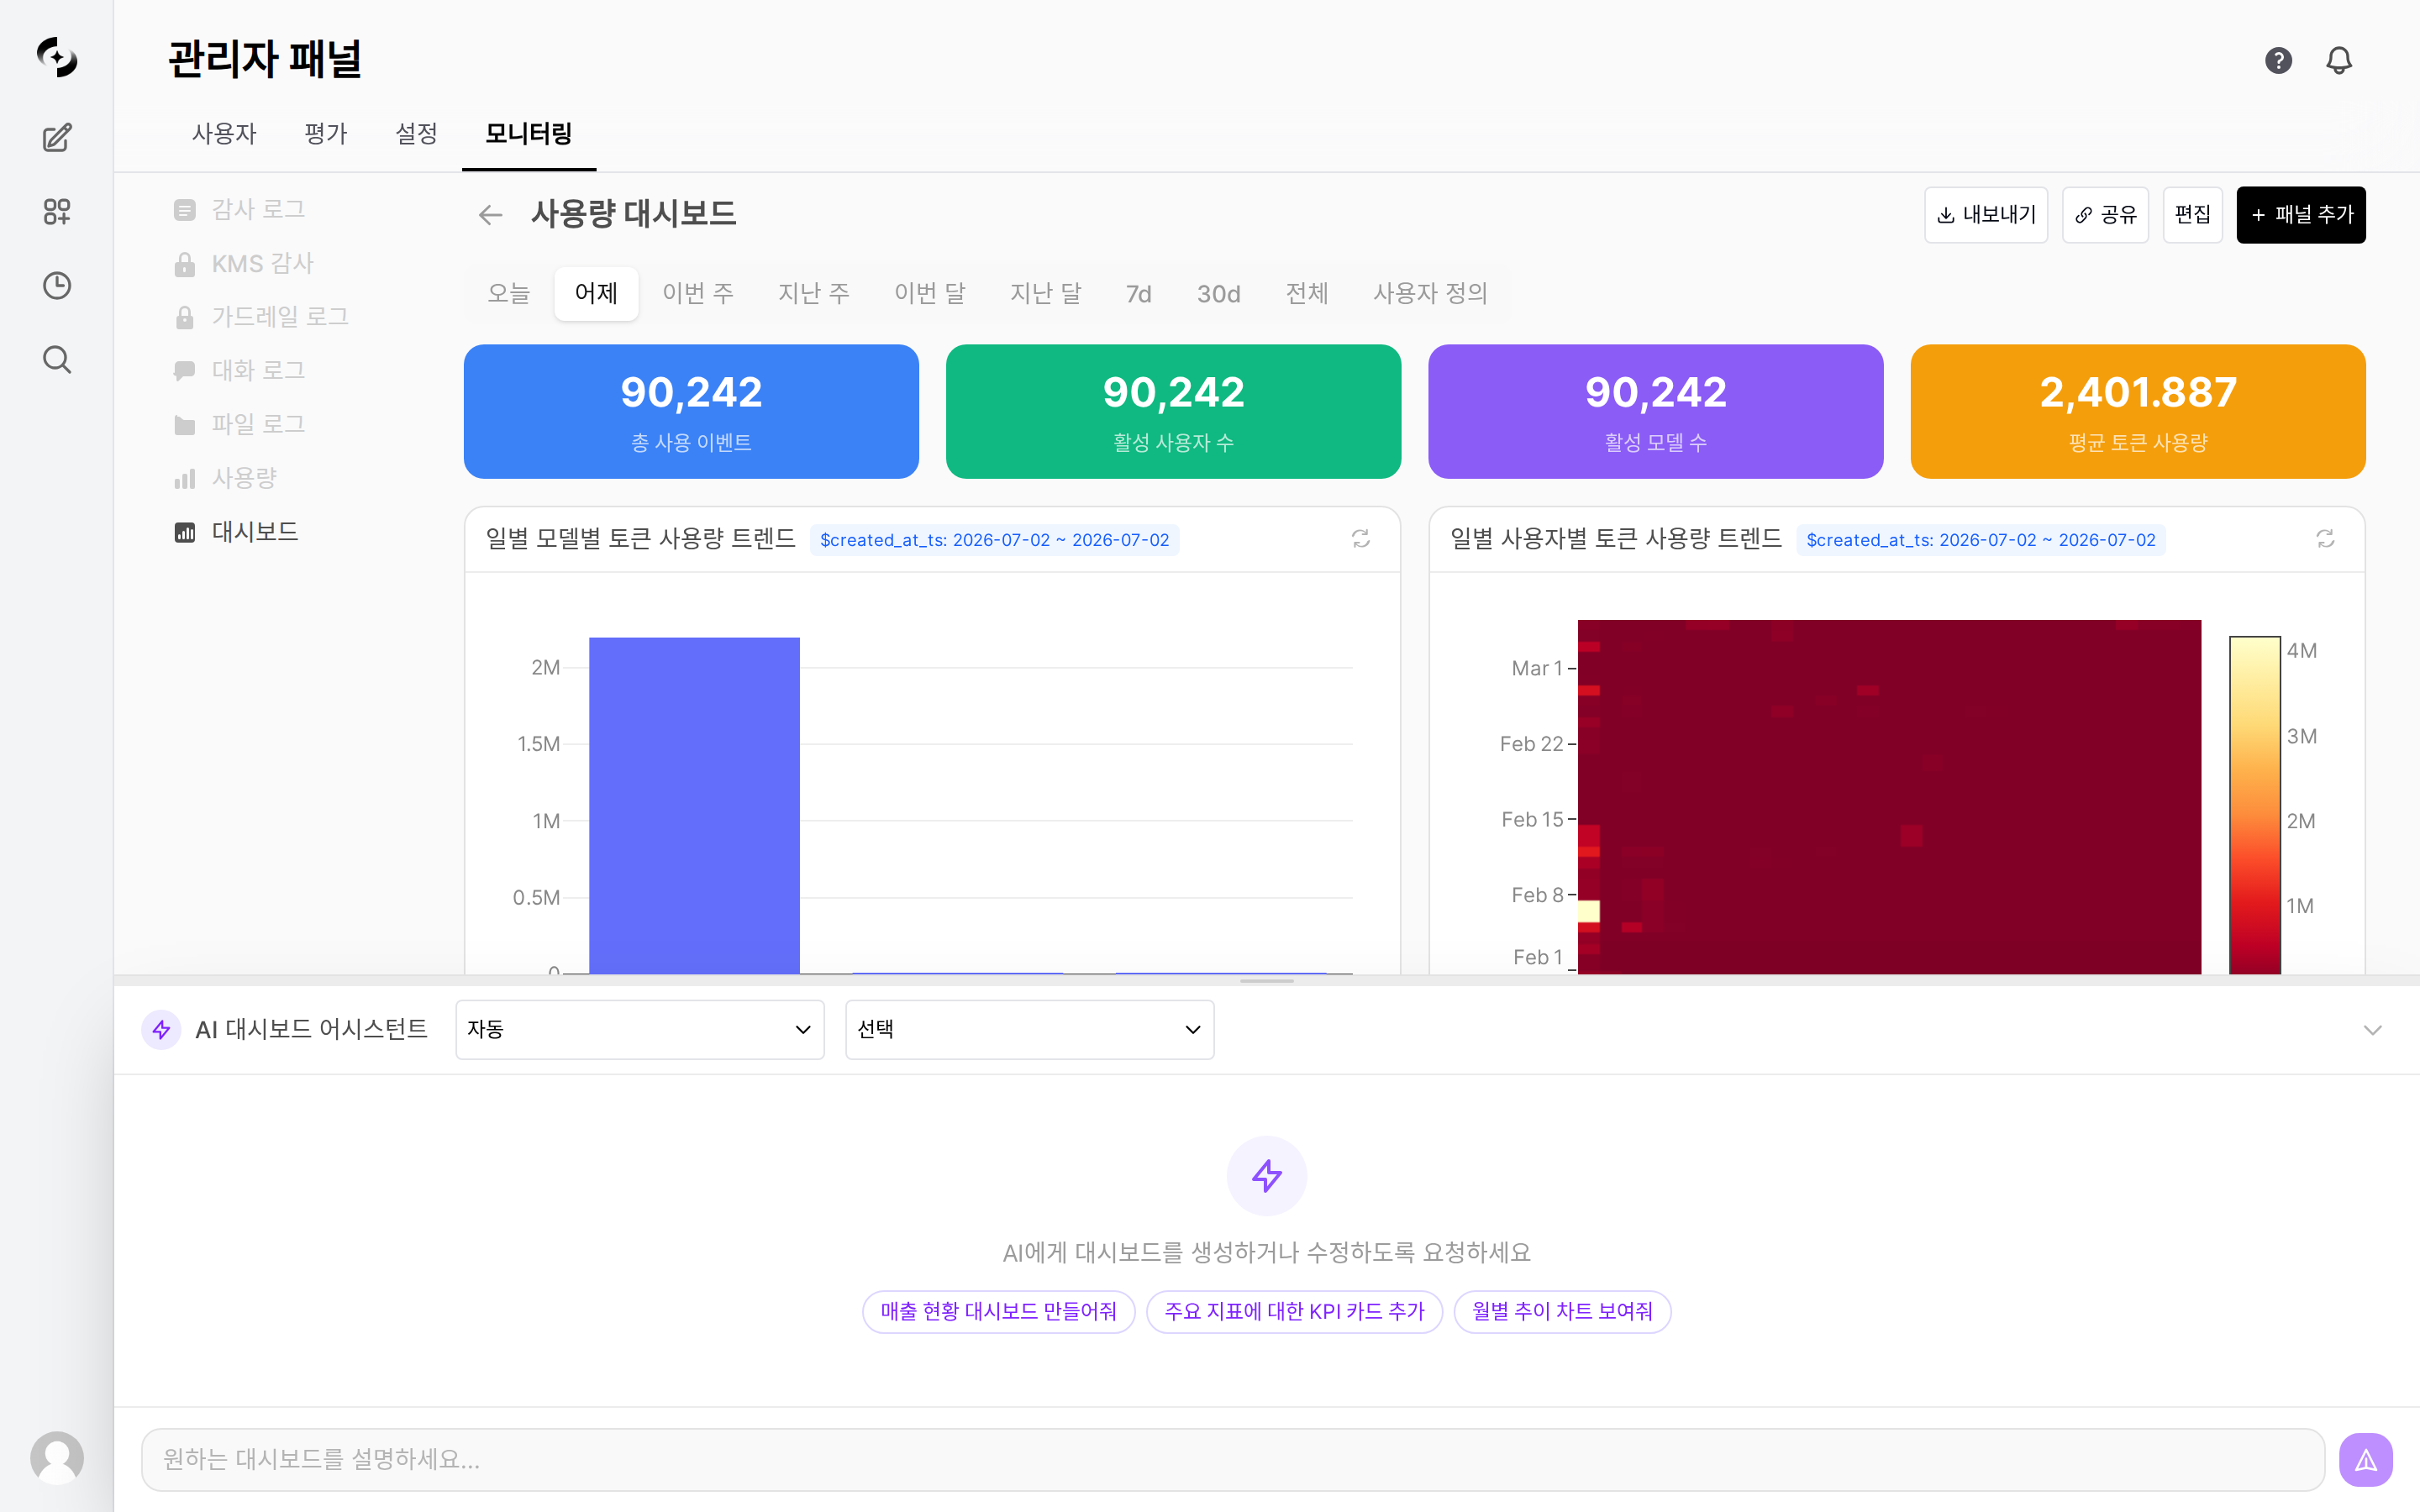 ### Conversational Dashboard Builder
Add, edit, and delete panels by chatting in natural language.
Click the bottom-right purple button. Pick **DB** and **model** at the top.
Examples:
* "Make a chart of this month's per-model token usage"
* "Add a per-user cost card too"
* "Change the period to 30 days"
* "Change the pie chart to a bar chart"
The AI generates SQL and auto-places panels. Positions are auto-adjusted to avoid overlap.
Continue panel edits/deletes/relayouts via additional conversation. Conversation history is saved on the dashboard.
**Example — Changing an Existing Chart Type**
Specify the panel to change, and the same data is instantly redrawn as a different chart. For example, entering:
> `Change the Revenue by City bar chart to a pie chart`
### Conversational Dashboard Builder
Add, edit, and delete panels by chatting in natural language.
Click the bottom-right purple button. Pick **DB** and **model** at the top.
Examples:
* "Make a chart of this month's per-model token usage"
* "Add a per-user cost card too"
* "Change the period to 30 days"
* "Change the pie chart to a bar chart"
The AI generates SQL and auto-places panels. Positions are auto-adjusted to avoid overlap.
Continue panel edits/deletes/relayouts via additional conversation. Conversation history is saved on the dashboard.
**Example — Changing an Existing Chart Type**
Specify the panel to change, and the same data is instantly redrawn as a different chart. For example, entering:
> `Change the Revenue by City bar chart to a pie chart`
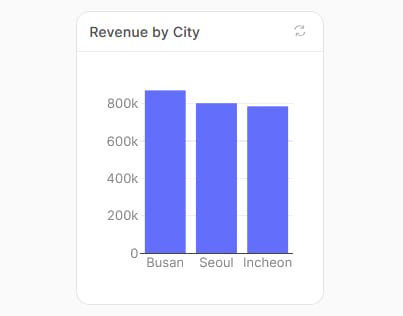
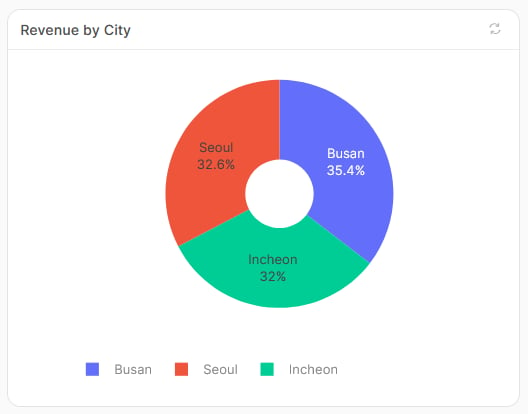 The AI sometimes presents button-form choices. Click for quick responses.
### One-shot Generation
Starting fresh with an empty dashboard, describe the dashboard's **purpose** to the AI to generate a suitable panel set at once.
* DB connection is auto-tested first, generating only when valid.
***
## Filtering
The dashboard top has **period filter** and **custom filters**.
| Preset | Description |
| ----------------------- | -------------------------------- |
| Today / Yesterday | Today / Yesterday |
| This Week / Last Week | This week / Last week |
| This Month / Last Month | This month / Last month |
| 7d / 30d | Last 7 / 30 days |
| All | Entire period |
| Custom | Specify start/end dates directly |
Default is **Yesterday**. Changing the period auto-re-executes SQL on all panels with `period filter` enabled.
In edit mode, use the **Add Filter** button to add filters that apply to the entire dashboard.
| Filter Type | Description |
| -------------- | -------------------------------- |
| **Text** | Free text input (e.g., username) |
| **Date Range** | Start \~ end date range |
| **Select** | Selection options |
When adding a filter, specify the **display label** and **DB column name**. Active filters appear as blue badges at the top of each panel.
***
## Sharing
Share completed dashboards with team members.
Click the **Share** button at the top of the dashboard to open the **Share Dashboard** window; the share URL is automatically copied to the clipboard.
The AI sometimes presents button-form choices. Click for quick responses.
### One-shot Generation
Starting fresh with an empty dashboard, describe the dashboard's **purpose** to the AI to generate a suitable panel set at once.
* DB connection is auto-tested first, generating only when valid.
***
## Filtering
The dashboard top has **period filter** and **custom filters**.
| Preset | Description |
| ----------------------- | -------------------------------- |
| Today / Yesterday | Today / Yesterday |
| This Week / Last Week | This week / Last week |
| This Month / Last Month | This month / Last month |
| 7d / 30d | Last 7 / 30 days |
| All | Entire period |
| Custom | Specify start/end dates directly |
Default is **Yesterday**. Changing the period auto-re-executes SQL on all panels with `period filter` enabled.
In edit mode, use the **Add Filter** button to add filters that apply to the entire dashboard.
| Filter Type | Description |
| -------------- | -------------------------------- |
| **Text** | Free text input (e.g., username) |
| **Date Range** | Start \~ end date range |
| **Select** | Selection options |
When adding a filter, specify the **display label** and **DB column name**. Active filters appear as blue badges at the top of each panel.
***
## Sharing
Share completed dashboards with team members.
Click the **Share** button at the top of the dashboard to open the **Share Dashboard** window; the share URL is automatically copied to the clipboard.
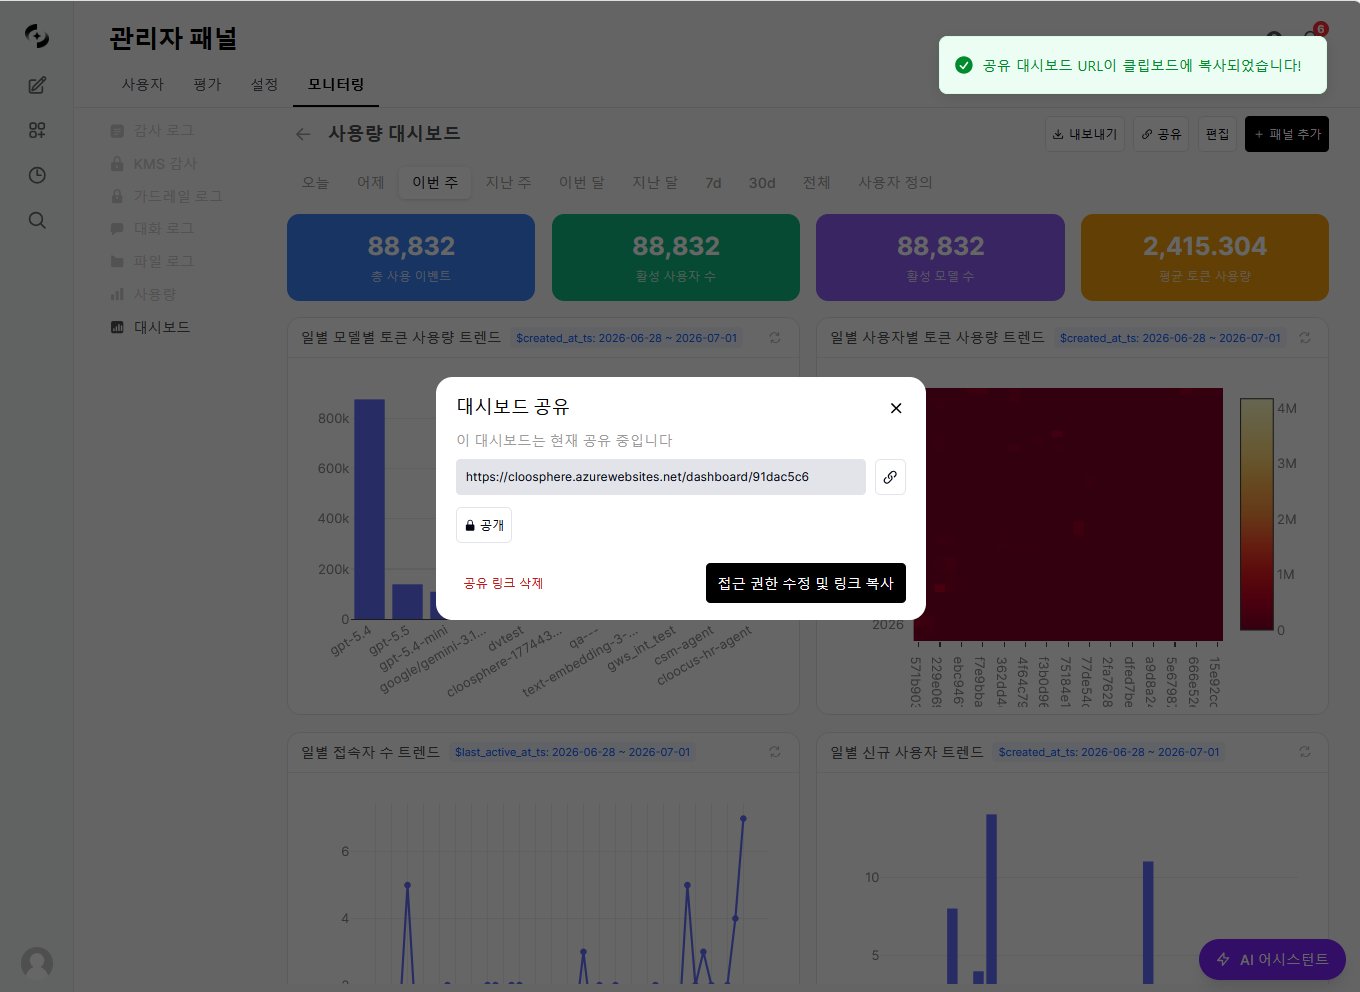 Share URL format: `https://{domain}/dashboard/{share_id}`. Use **Delete share link** to revoke sharing at any time.
Click **Edit access and copy link** to open the **Access Control** window. Specify the visibility scope and who can access.
Share URL format: `https://{domain}/dashboard/{share_id}`. Use **Delete share link** to revoke sharing at any time.
Click **Edit access and copy link** to open the **Access Control** window. Specify the visibility scope and who can access.
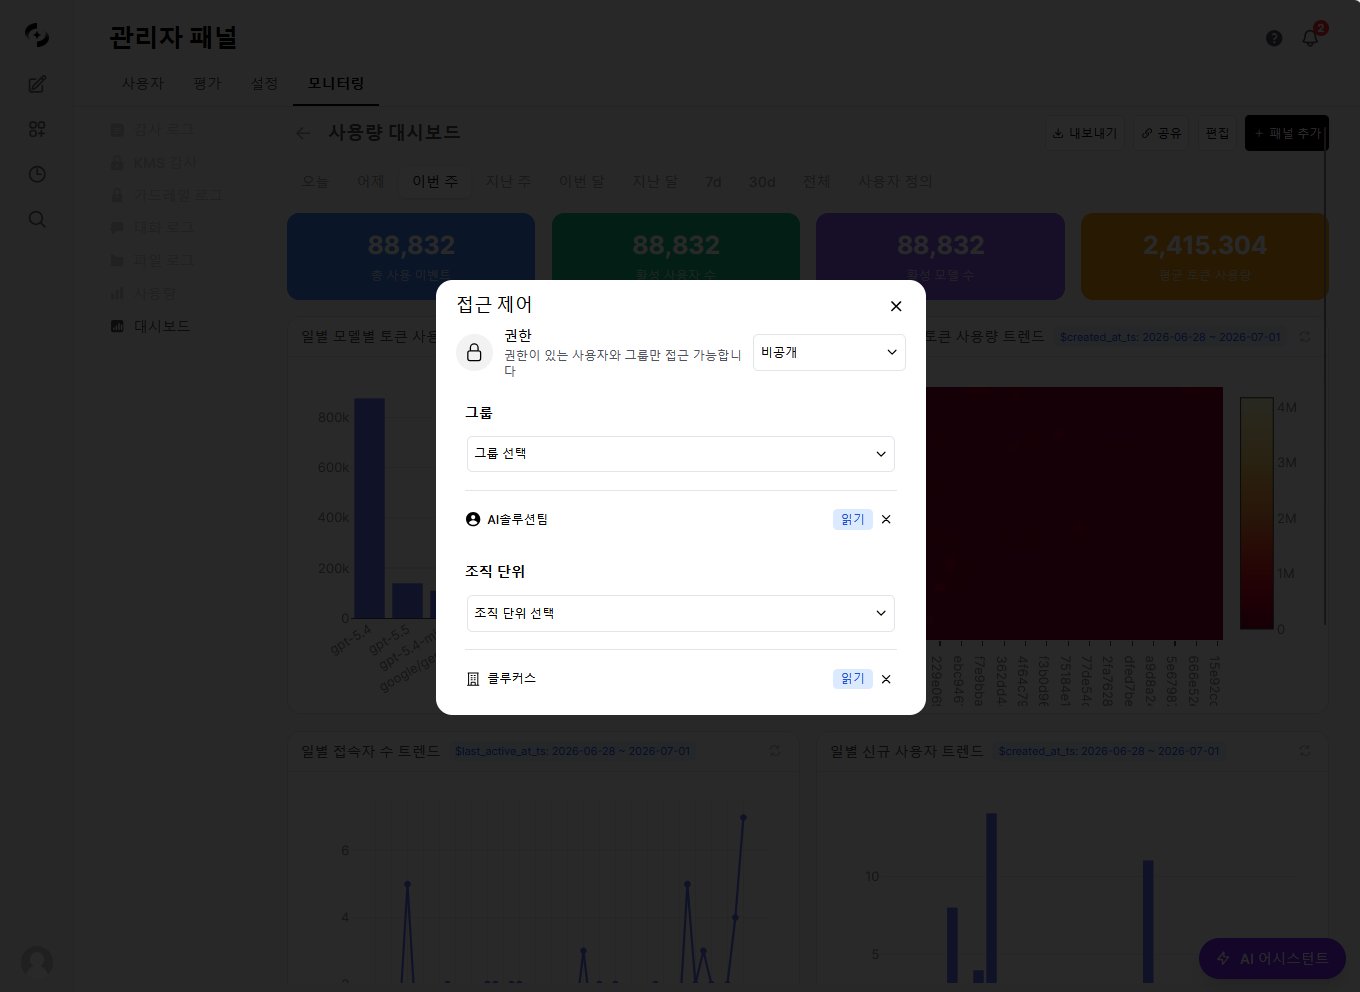 | Item | Description |
| ------------------------ | --------------------------------------------------------------------------------------------- |
| **Permission** | Toggle between **Public** (all signed-in users) and **Private** (only users/groups you grant) |
| **Groups** | Grant **read** access to specified groups |
| **Organizational units** | Grant **read** access to specified organizational units (OUs) |
When done, click **Edit access and copy link** to save the changes and copy the link again.
Shared dashboards operate as **view-only** — period filter and custom filters can query data, but panel edit/add/delete and AI Assistant are disabled.
Sign-in is **required** to access share links. Non-signed-in users go to the sign-in page and auto-return to the dashboard.
***
## HTML Export
Export dashboards as **standalone HTML files**.
* Click the **Export** button at the top of the dashboard to execute SQL with the currently applied period and filter conditions, downloading the HTML file with the latest data.
**Exported file characteristics:**
| Item | Description |
| --------------------- | -------------------------------------------------------- |
| **Format** | Single HTML file (no external dependencies) |
| **Chart interaction** | Hover, zoom, and other Plotly default features supported |
| **Theme** | Light/dark mode auto-supported (follows system setting) |
| **Layout** | Same 12-column grid as the dashboard |
| **Responsive** | Charts auto-adjust on window resize |
Exported HTML files can be email-attached, uploaded to internal share drives, or integrated with scheduled tasks for **regular reports**. See [Schedules](/en/automation/schedules) for details.
***
## Security
| Item | Policy |
| ----------------- | -------------------------------------------------------------------------------------------------------- |
| **SQL execution** | Only `SELECT` queries allowed. INSERT/UPDATE/DELETE/DROP and other modification queries are blocked |
| **Filter input** | Special character escaping to prevent SQL Injection |
| **Share access** | Verification based on access control (public/private permission + group/organizational-unit designation) |
| **DB connection** | Only read-only connections registered in DbSphere |
***
## Use Cases
1. AI auto-generation via "Make a key KPI dashboard for this month"
2. Card panels show key values (total revenue, active user count, etc.)
3. Line charts show daily trends
4. Share as Public for team-wide access
1. Compose monthly report panels in the dashboard
2. Integrate HTML export with scheduled tasks
3. Auto-generate HTML reports and email every Monday morning
1. Generate charts via "Compare per-model token usage and cost"
2. Grouped Bar for per-model · per-period comparison
3. Analyze across last 7 days/30 days/all via period filter
***
## Related Pages
Configure databases that the Dashboard connects to
Scheduler for automating dashboard exports
Token usage and cost statistics dashboard
| Item | Description |
| ------------------------ | --------------------------------------------------------------------------------------------- |
| **Permission** | Toggle between **Public** (all signed-in users) and **Private** (only users/groups you grant) |
| **Groups** | Grant **read** access to specified groups |
| **Organizational units** | Grant **read** access to specified organizational units (OUs) |
When done, click **Edit access and copy link** to save the changes and copy the link again.
Shared dashboards operate as **view-only** — period filter and custom filters can query data, but panel edit/add/delete and AI Assistant are disabled.
Sign-in is **required** to access share links. Non-signed-in users go to the sign-in page and auto-return to the dashboard.
***
## HTML Export
Export dashboards as **standalone HTML files**.
* Click the **Export** button at the top of the dashboard to execute SQL with the currently applied period and filter conditions, downloading the HTML file with the latest data.
**Exported file characteristics:**
| Item | Description |
| --------------------- | -------------------------------------------------------- |
| **Format** | Single HTML file (no external dependencies) |
| **Chart interaction** | Hover, zoom, and other Plotly default features supported |
| **Theme** | Light/dark mode auto-supported (follows system setting) |
| **Layout** | Same 12-column grid as the dashboard |
| **Responsive** | Charts auto-adjust on window resize |
Exported HTML files can be email-attached, uploaded to internal share drives, or integrated with scheduled tasks for **regular reports**. See [Schedules](/en/automation/schedules) for details.
***
## Security
| Item | Policy |
| ----------------- | -------------------------------------------------------------------------------------------------------- |
| **SQL execution** | Only `SELECT` queries allowed. INSERT/UPDATE/DELETE/DROP and other modification queries are blocked |
| **Filter input** | Special character escaping to prevent SQL Injection |
| **Share access** | Verification based on access control (public/private permission + group/organizational-unit designation) |
| **DB connection** | Only read-only connections registered in DbSphere |
***
## Use Cases
1. AI auto-generation via "Make a key KPI dashboard for this month"
2. Card panels show key values (total revenue, active user count, etc.)
3. Line charts show daily trends
4. Share as Public for team-wide access
1. Compose monthly report panels in the dashboard
2. Integrate HTML export with scheduled tasks
3. Auto-generate HTML reports and email every Monday morning
1. Generate charts via "Compare per-model token usage and cost"
2. Grouped Bar for per-model · per-period comparison
3. Analyze across last 7 days/30 days/all via period filter
***
## Related Pages
Configure databases that the Dashboard connects to
Scheduler for automating dashboard exports
Token usage and cost statistics dashboard