> ## Documentation Index
> Fetch the complete documentation index at: https://docs.cloosphere.ai/llms.txt
> Use this file to discover all available pages before exploring further.
# Monitoring Overview
> Two axes of operational visibility — Monitoring (system usage) and Evaluation (AI response quality)
Admin Panel › Monitoring · Evaluations
Cloosphere's **operational visibility** splits into two axes.
1. **Monitoring** — how the system is being used (activity · usage · logs)
2. **Evaluation** — how good the AI responses are (feedback · quality)
These are **separate menus with different purposes** in the admin panel. Pick the axis you want from the tabs below.
Admin › Monitoring
The menu for **system operations**. The **Audit Logs** tab is the default landing.
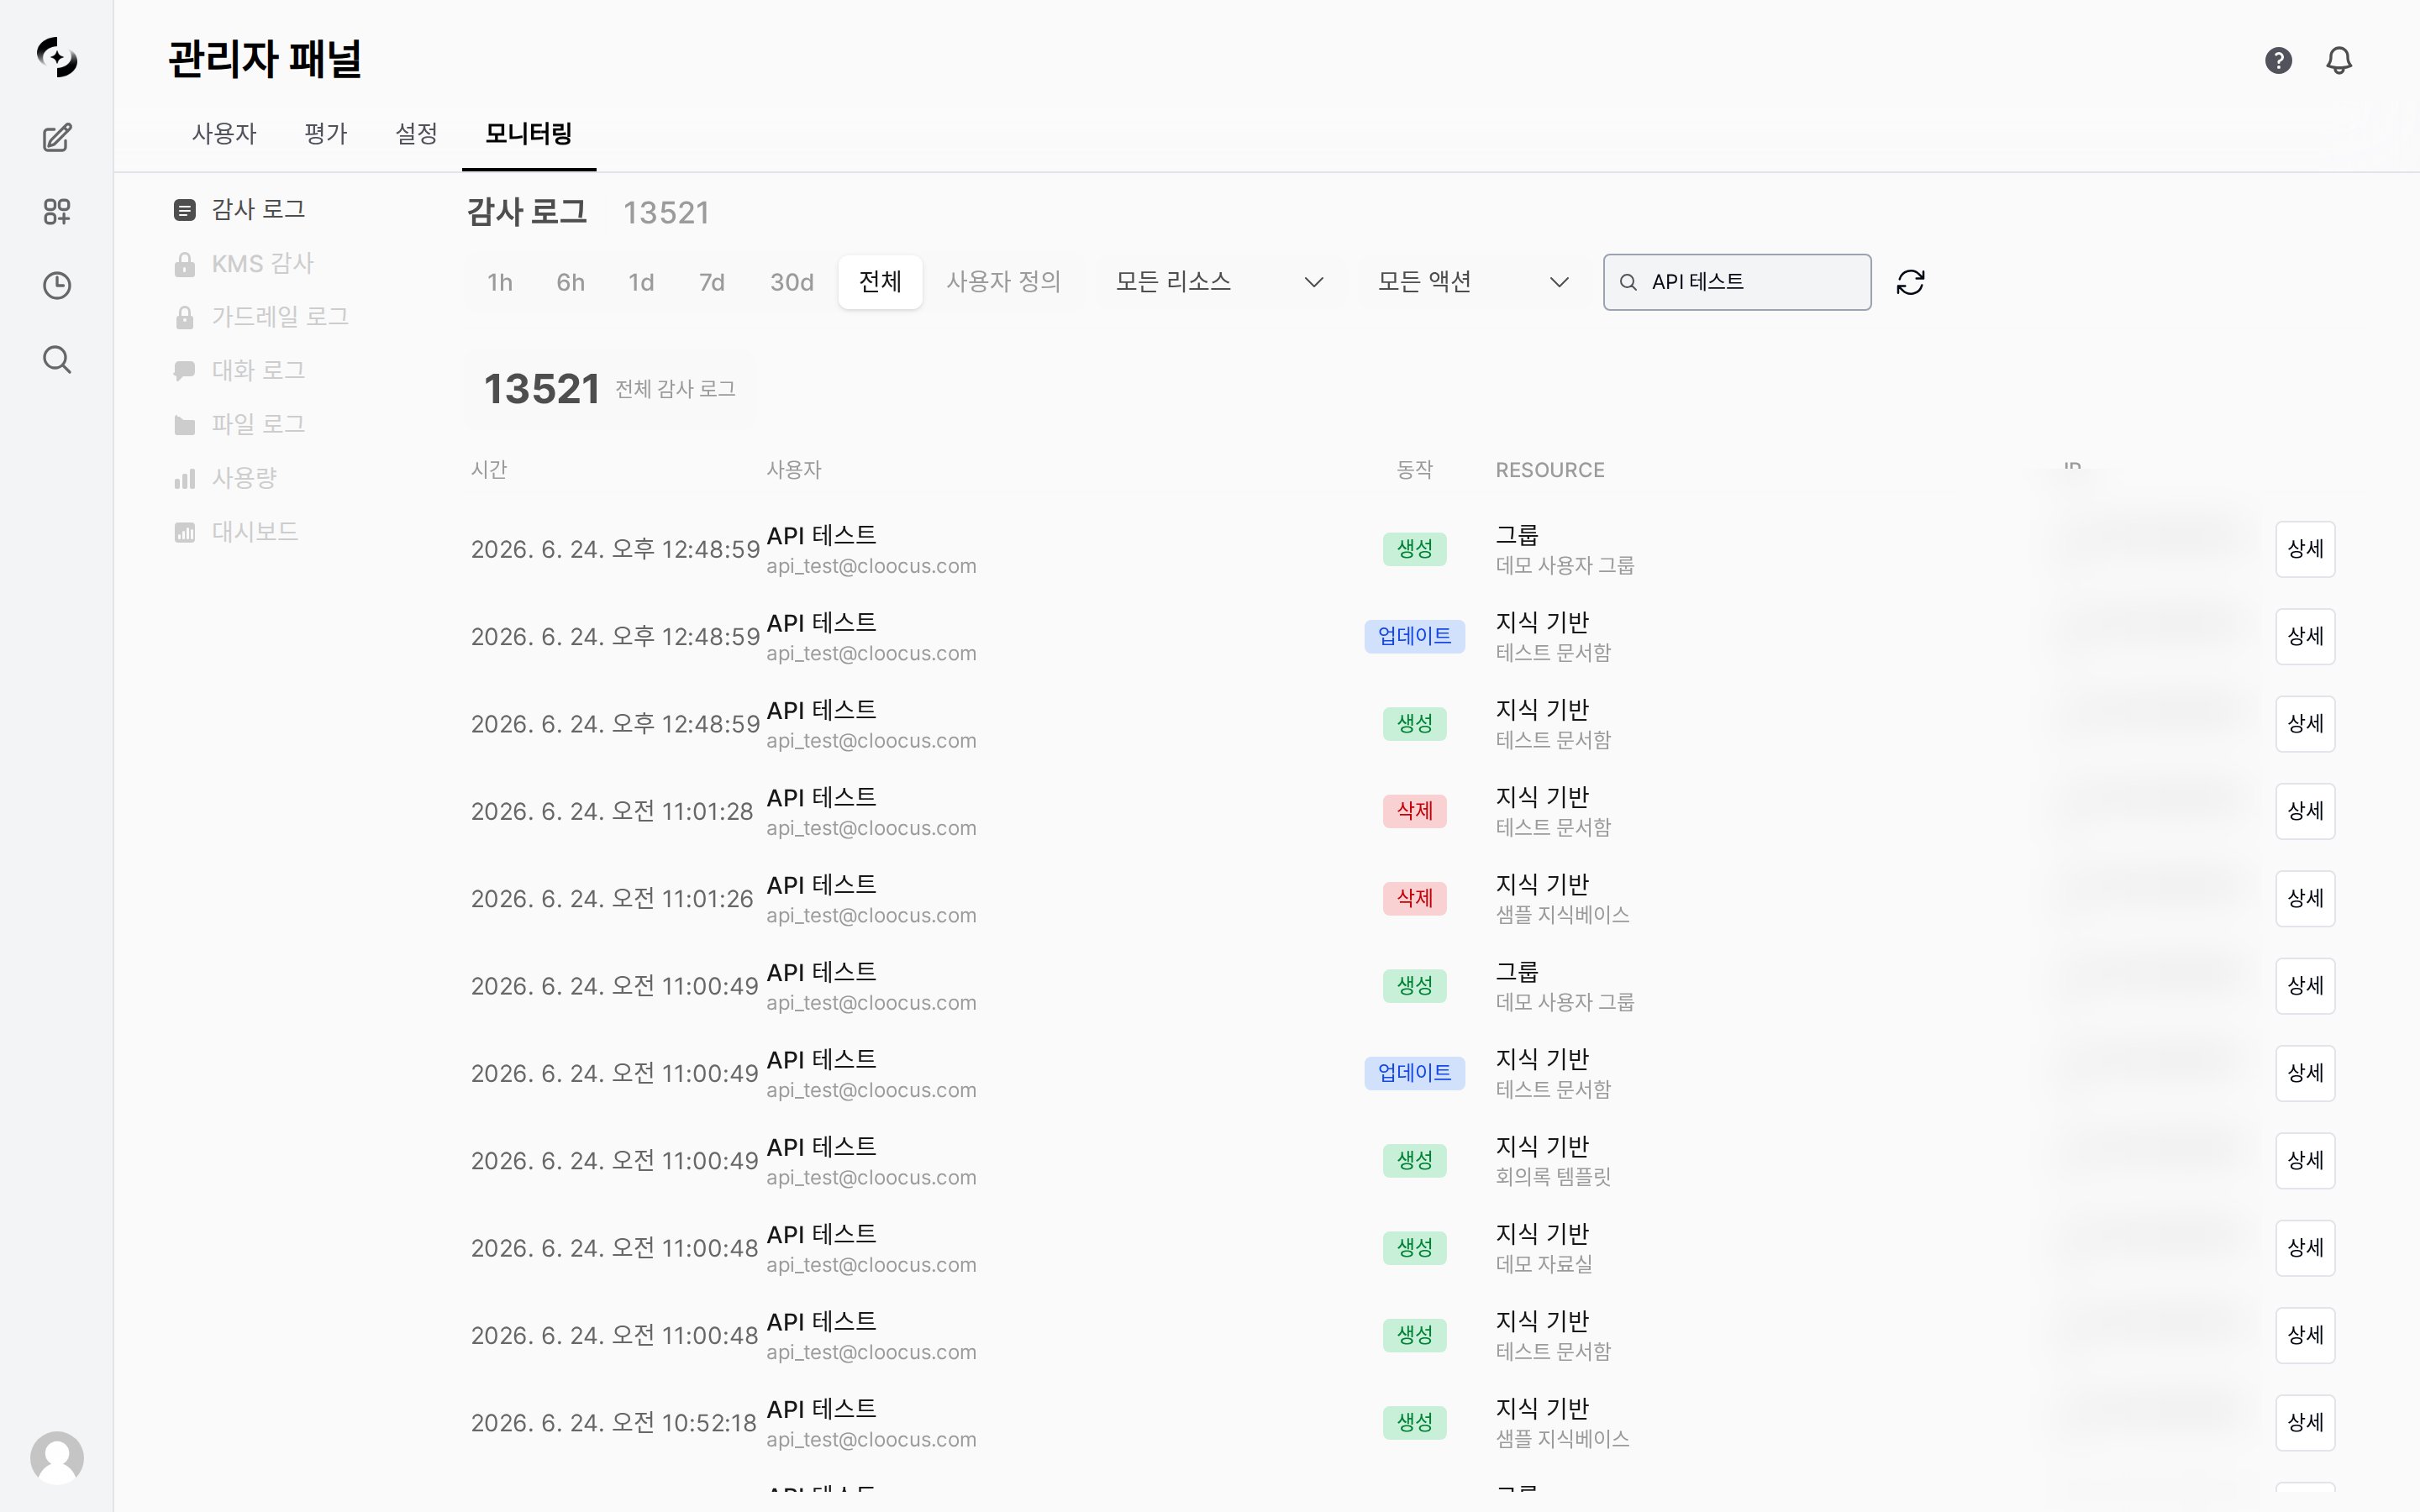 | Tab | Function |
| --------------------------------------------------------- | ----------------------------------------------------------------------------------------- |
| [**Audit Logs**](/en/monitoring/audit-logs) | View user activity records |
| [**KMS Audit**](/en/monitoring/kms-audit) | Audit log of encryption key management (KMS) operations |
| [**Guardrail Logs**](/en/monitoring/guardrail-logs) | View guardrail detection/blocking events |
| [**Conversation Logs**](/en/monitoring/conversation-logs) | View token usage per individual conversation (request) |
| [**File Logs**](/en/monitoring/file-logs) | File upload security monitoring (guardrail classification, blocked/flagged file tracking) |
| [**Usage**](/en/monitoring/usage) | Token usage, cost, statistics dashboard |
| [**Dashboard**](/en/monitoring/dashboard) | AI-based panel charts, sharing, HTML export |
The **Conversation Logs** tab lists individual conversations (requests) row by row. See [Conversation Logs](/en/monitoring/conversation-logs) for details.
The **File Logs** tab is always shown. Only files that have file guardrail results are recorded, so the list can be empty on instances that don't use file guardrails.
The **Audit Logs** · **KMS Audit** · **Dashboard** tabs, and the **Auto-evaluation** · **Tracing** tabs under Evaluations, appear only when your license includes those features. If it doesn't, they never show up in the menu. Check your license under [Admin › Settings › License](/en/admin/settings/license).
Admin › Evaluations
The menu for **AI response quality**.
| Tab | Function |
| --------------------------------------------------------- | ----------------------------------------------------------------------------------------- |
| [**Audit Logs**](/en/monitoring/audit-logs) | View user activity records |
| [**KMS Audit**](/en/monitoring/kms-audit) | Audit log of encryption key management (KMS) operations |
| [**Guardrail Logs**](/en/monitoring/guardrail-logs) | View guardrail detection/blocking events |
| [**Conversation Logs**](/en/monitoring/conversation-logs) | View token usage per individual conversation (request) |
| [**File Logs**](/en/monitoring/file-logs) | File upload security monitoring (guardrail classification, blocked/flagged file tracking) |
| [**Usage**](/en/monitoring/usage) | Token usage, cost, statistics dashboard |
| [**Dashboard**](/en/monitoring/dashboard) | AI-based panel charts, sharing, HTML export |
The **Conversation Logs** tab lists individual conversations (requests) row by row. See [Conversation Logs](/en/monitoring/conversation-logs) for details.
The **File Logs** tab is always shown. Only files that have file guardrail results are recorded, so the list can be empty on instances that don't use file guardrails.
The **Audit Logs** · **KMS Audit** · **Dashboard** tabs, and the **Auto-evaluation** · **Tracing** tabs under Evaluations, appear only when your license includes those features. If it doesn't, they never show up in the menu. Check your license under [Admin › Settings › License](/en/admin/settings/license).
Admin › Evaluations
The menu for **AI response quality**.
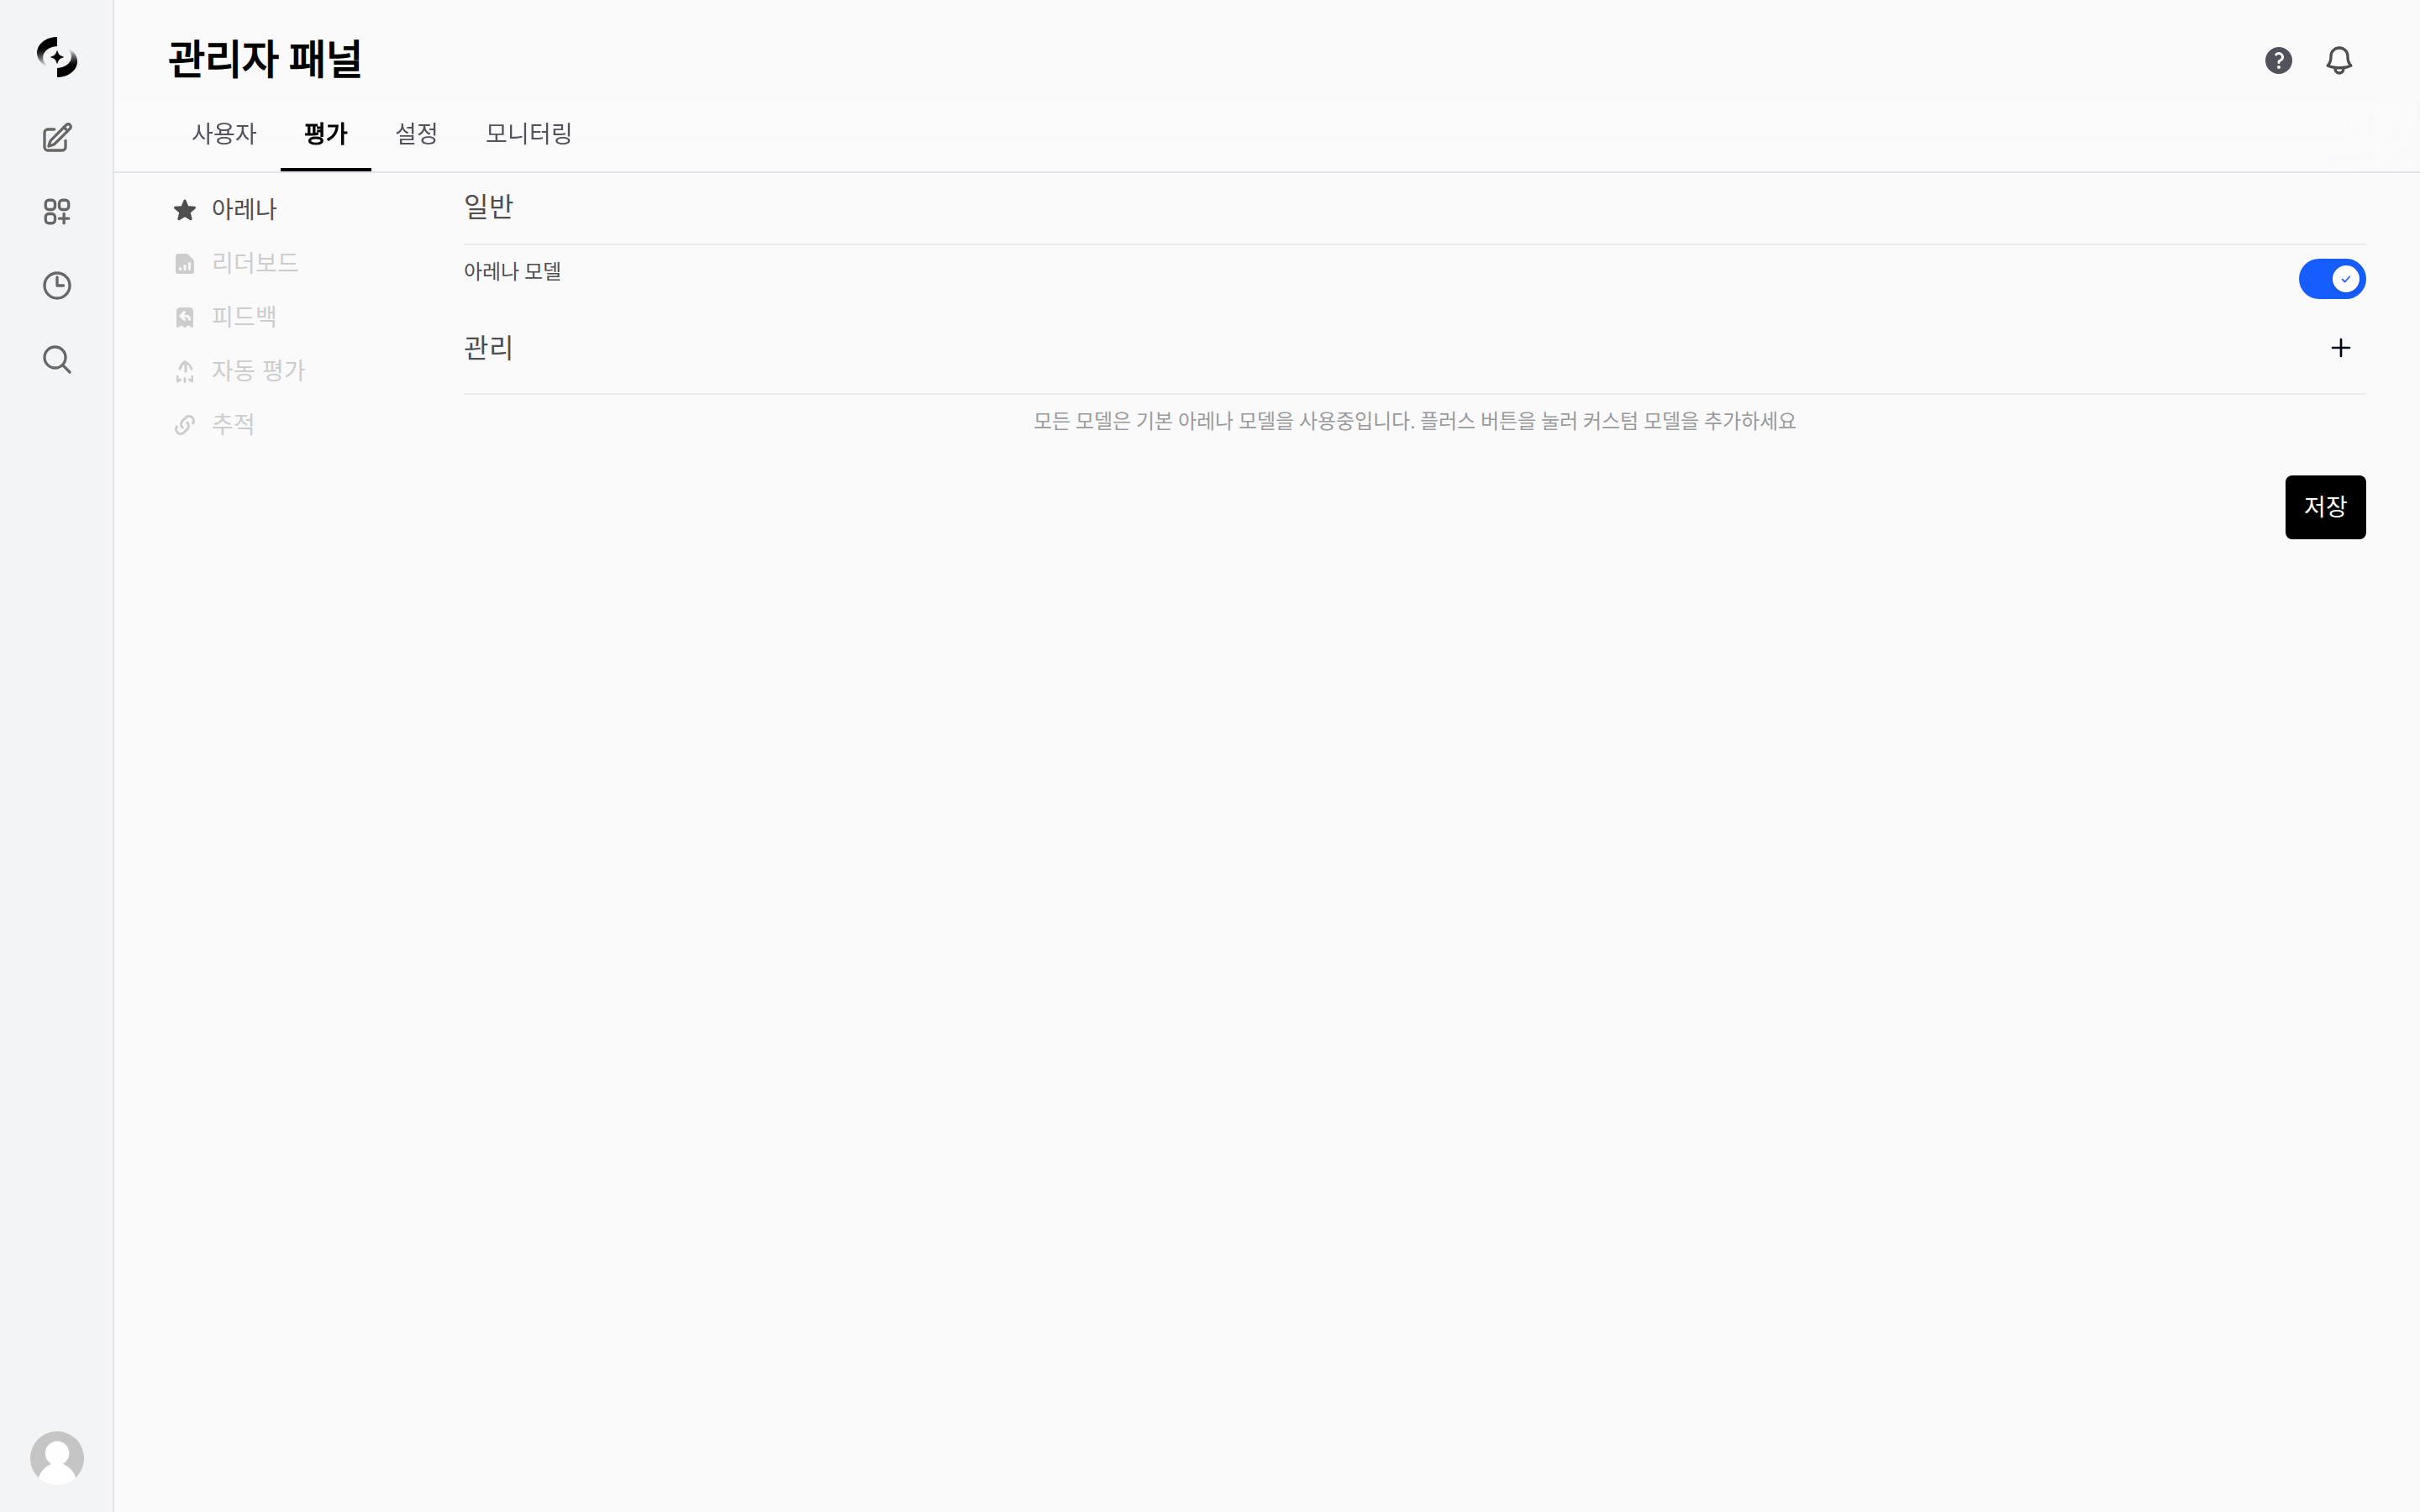 | Tab | Function |
| --------------------------------------------------------------- | -------------------------------------------------------------------- |
| [**Arena**](/en/monitoring/arena-leaderboard#arena) | Blind side-by-side comparison of two models' responses (default tab) |
| [**Leaderboard**](/en/monitoring/arena-leaderboard#leaderboard) | Elo-based model ranking from Arena results |
| [**Feedback**](/en/monitoring/feedback) | View user response evaluation (win/loss) records |
| [**Auto-evaluation**](/en/monitoring/auto-evaluations) | LLM-based response quality auto-measurement results |
| [**Tracing**](/en/monitoring/tracing) | LLM request processing tracking |
Evaluation has its own overview — see [Evaluation](/en/monitoring/evaluations) for the measure→diagnose flow and each tab.
***
## Use Cases
| Scenario | How |
| ----------------------------------- | --------------------------------------------------------------------------------------------------------- |
| **Monthly AI Cost Analysis** | Check token consumption and cost by period/organization/model in Usage to compile the monthly cost report |
| **Security Incident Investigation** | Filter suspicious activity in audit logs by time range/user to trace incident details |
| **Response Quality Debugging** | In tracing, review step-by-step processing for a specific message and generate an LLM analysis report |
| **Guardrail Policy Improvement** | Analyze detection patterns in guardrail logs to reduce false positives and strengthen security policy |
Cost amounts only appear when the price per 1M tokens has been entered per model under [Admin › Settings › Models › Model Pricing](/en/admin/settings/models#model-pricing). Models with no price are excluded from the cost estimate (token counts are still aggregated).
***
## Recommended Review Cadence
| Cadence | Items |
| ------------- | ----------------------------------------------------------------- |
| **Daily** | Anomalous usage patterns, guardrail blocking events |
| **Weekly** | Usage trends, auto-evaluation score trend review |
| **Monthly** | Cost analysis report, audit log summary, guardrail policy review |
| **Quarterly** | Overall utilization assessment, model cost-effectiveness analysis |
| Tab | Function |
| --------------------------------------------------------------- | -------------------------------------------------------------------- |
| [**Arena**](/en/monitoring/arena-leaderboard#arena) | Blind side-by-side comparison of two models' responses (default tab) |
| [**Leaderboard**](/en/monitoring/arena-leaderboard#leaderboard) | Elo-based model ranking from Arena results |
| [**Feedback**](/en/monitoring/feedback) | View user response evaluation (win/loss) records |
| [**Auto-evaluation**](/en/monitoring/auto-evaluations) | LLM-based response quality auto-measurement results |
| [**Tracing**](/en/monitoring/tracing) | LLM request processing tracking |
Evaluation has its own overview — see [Evaluation](/en/monitoring/evaluations) for the measure→diagnose flow and each tab.
***
## Use Cases
| Scenario | How |
| ----------------------------------- | --------------------------------------------------------------------------------------------------------- |
| **Monthly AI Cost Analysis** | Check token consumption and cost by period/organization/model in Usage to compile the monthly cost report |
| **Security Incident Investigation** | Filter suspicious activity in audit logs by time range/user to trace incident details |
| **Response Quality Debugging** | In tracing, review step-by-step processing for a specific message and generate an LLM analysis report |
| **Guardrail Policy Improvement** | Analyze detection patterns in guardrail logs to reduce false positives and strengthen security policy |
Cost amounts only appear when the price per 1M tokens has been entered per model under [Admin › Settings › Models › Model Pricing](/en/admin/settings/models#model-pricing). Models with no price are excluded from the cost estimate (token counts are still aggregated).
***
## Recommended Review Cadence
| Cadence | Items |
| ------------- | ----------------------------------------------------------------- |
| **Daily** | Anomalous usage patterns, guardrail blocking events |
| **Weekly** | Usage trends, auto-evaluation score trend review |
| **Monthly** | Cost analysis report, audit log summary, guardrail policy review |
| **Quarterly** | Overall utilization assessment, model cost-effectiveness analysis |