> ## Documentation Index
> Fetch the complete documentation index at: https://docs.cloosphere.ai/llms.txt
> Use this file to discover all available pages before exploring further.
# Tracing
> Step-by-step LLM request processing tracking — review I/O, analyze latency, generate LLM-based reports
Admin › Evaluation › Tracing
Tracing **records every step of AI request processing**.
* What documents were searched, what tools were invoked, what prompt was sent to the LLM — every step is transparently visible.
 **Example — without tracing vs. with tracing**
> Agent answered "I can't find that information"
| State | What's Possible | Result |
| --------------- | ------------------------------------------ | -------------------------------------------------- |
| Without tracing | Only guessing | Cannot identify cause |
| Using tracing | Confirmed 0 search results in the Run tree | KB document missing → resolved by adding documents |
Tracing is a licensed feature. Requires a license with `trace` feature enabled.
***
## Tracing Concepts
Processing a single user message involves multiple steps.
* Tracing records all these steps in a **Trace > Run** hierarchy.
```mermaid theme={null}
flowchart TB
A[User message] --> B[Trace start]
B --> C[Response Chain]
C --> D[Guardrail check]
C --> E[RAG search]
C --> F[LLM call]
C --> G[Tool execution]
F --> H[Generate response]
H --> L[Trace complete]
A -.-> BG[background_tasks trace]
BG --> I[Title generation]
BG --> J[Tag generation]
BG --> K[Search query generation]
```
| Concept | Description |
| ------------ | --------------------------------------------- |
| **Trace** | Full processing for a single message |
| **Run** | Individual processing step within a Trace |
| **Run tree** | Run hierarchy with parent-child relationships |
***
## Tracing Entry Methods
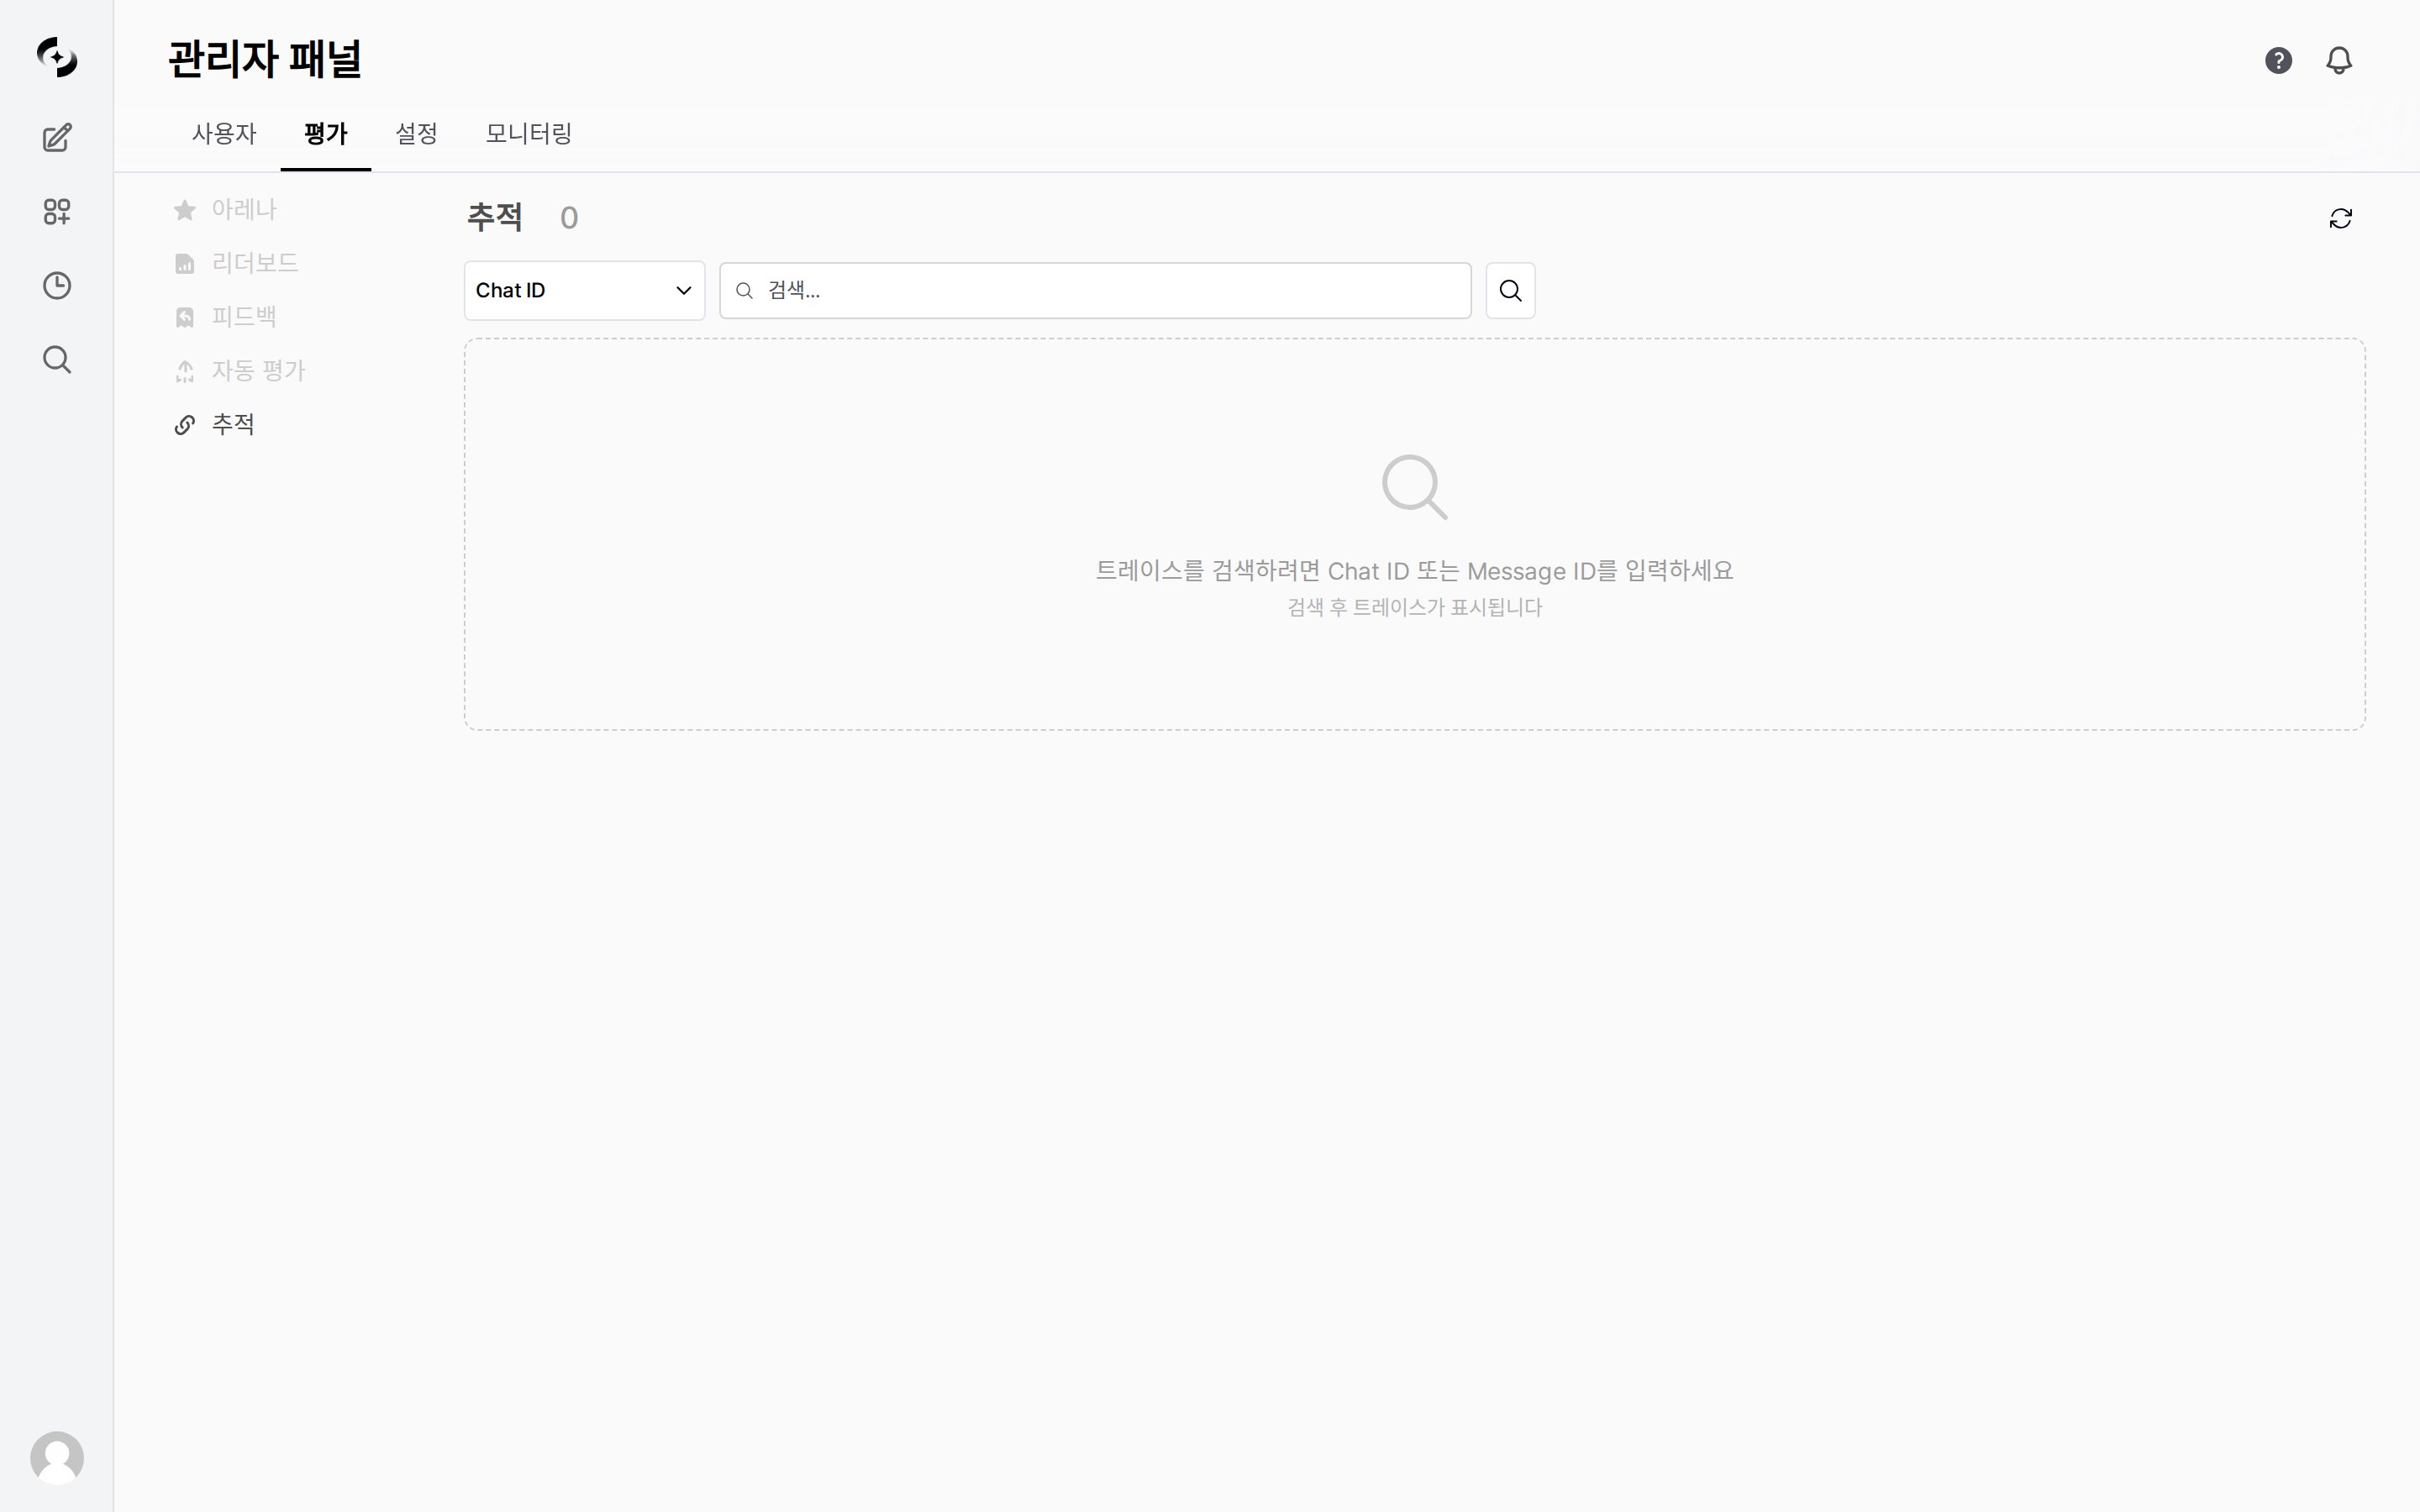
All three paths lead to the same **Evaluation › Tracing** screen — buttons ① and ② navigate automatically when clicked, while ③ searches directly by ID.
| Method | Best For | Entry Path |
| ---------------------------- | ------------------------------------------------------------------------ | ---------------------------------------------------------------- |
| **① From conversation logs** | Admin investigating a specific conversation during operations (standard) | Monitoring › Conversation Logs › select conversation › **Trace** |
| **② Directly from chat** | Instantly checking a response you just received mid-conversation | Chat response action bar › **View Tracing** button |
| **③ Search by ID** | Investigating a specific trace from a forwarded ID | Evaluation › Tracing › Chat ID / Message ID search |
The standard path where an admin picks a specific conversation from the operations screen and enters tracing.
Go to **Monitoring › Conversation Logs**.
Click the conversation (request) row you want to investigate to open its detail.
**Example — without tracing vs. with tracing**
> Agent answered "I can't find that information"
| State | What's Possible | Result |
| --------------- | ------------------------------------------ | -------------------------------------------------- |
| Without tracing | Only guessing | Cannot identify cause |
| Using tracing | Confirmed 0 search results in the Run tree | KB document missing → resolved by adding documents |
Tracing is a licensed feature. Requires a license with `trace` feature enabled.
***
## Tracing Concepts
Processing a single user message involves multiple steps.
* Tracing records all these steps in a **Trace > Run** hierarchy.
```mermaid theme={null}
flowchart TB
A[User message] --> B[Trace start]
B --> C[Response Chain]
C --> D[Guardrail check]
C --> E[RAG search]
C --> F[LLM call]
C --> G[Tool execution]
F --> H[Generate response]
H --> L[Trace complete]
A -.-> BG[background_tasks trace]
BG --> I[Title generation]
BG --> J[Tag generation]
BG --> K[Search query generation]
```
| Concept | Description |
| ------------ | --------------------------------------------- |
| **Trace** | Full processing for a single message |
| **Run** | Individual processing step within a Trace |
| **Run tree** | Run hierarchy with parent-child relationships |
***
## Tracing Entry Methods
All three paths lead to the same **Evaluation › Tracing** screen — buttons ① and ② navigate automatically when clicked, while ③ searches directly by ID.
| Method | Best For | Entry Path |
| ---------------------------- | ------------------------------------------------------------------------ | ---------------------------------------------------------------- |
| **① From conversation logs** | Admin investigating a specific conversation during operations (standard) | Monitoring › Conversation Logs › select conversation › **Trace** |
| **② Directly from chat** | Instantly checking a response you just received mid-conversation | Chat response action bar › **View Tracing** button |
| **③ Search by ID** | Investigating a specific trace from a forwarded ID | Evaluation › Tracing › Chat ID / Message ID search |
The standard path where an admin picks a specific conversation from the operations screen and enters tracing.
Go to **Monitoring › Conversation Logs**.
Click the conversation (request) row you want to investigate to open its detail.
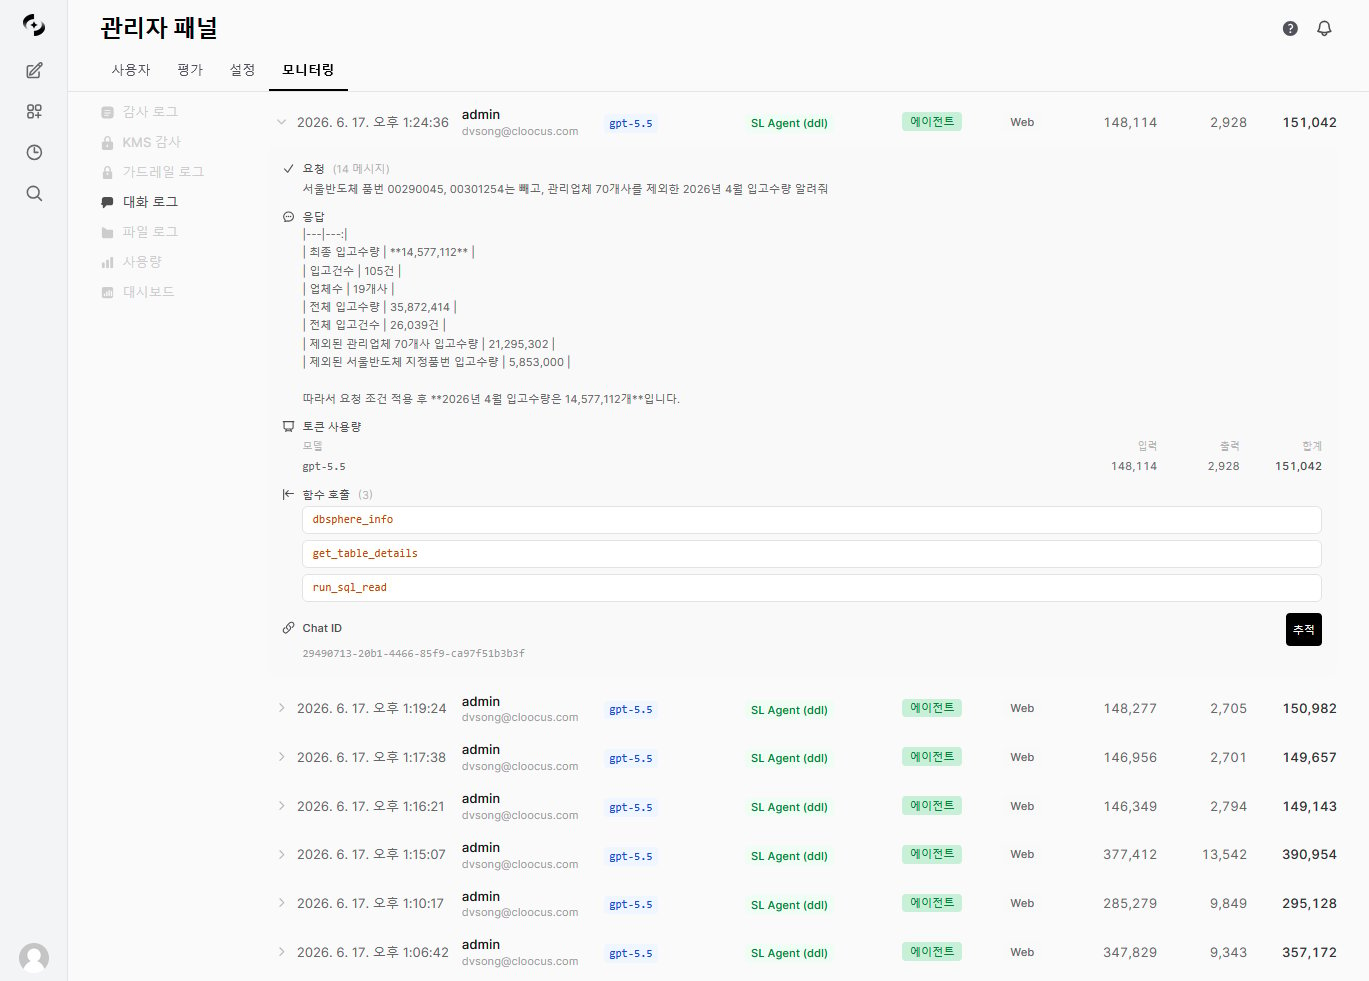 Clicking the **Trace** button in the detail automatically opens the [**Evaluation › Tracing**](#eval-trace-arrival) screen.
The path for tracing a response you just received right from the chat, on the spot.
Press the **View Tracing** button in the action bar below the response message you want to trace.
Clicking the **Trace** button in the detail automatically opens the [**Evaluation › Tracing**](#eval-trace-arrival) screen.
The path for tracing a response you just received right from the chat, on the spot.
Press the **View Tracing** button in the action bar below the response message you want to trace.
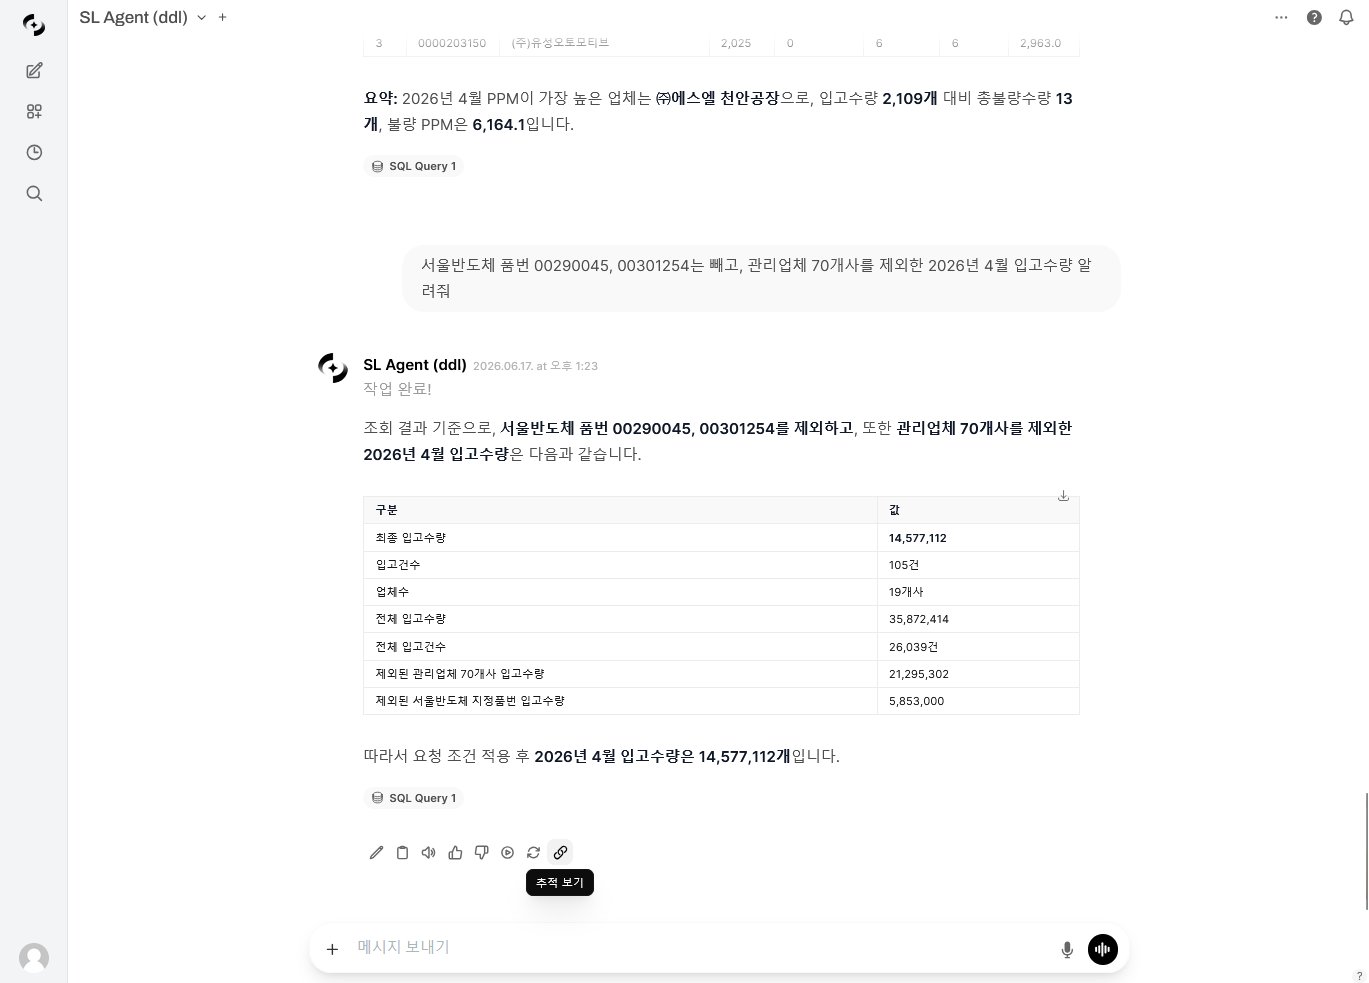 The button shown depends on your permissions.
| Permission | Button Shown |
| ----------------------------------------- | ------------------------------------------------------------------ |
| Admin or evaluation read/write permission | **View Tracing** → navigate to Evaluation › Tracing |
| Other users | **Copy Message ID** → forward to an admin to request investigation |
Pressing **View Tracing** automatically opens the [**Evaluation › Tracing**](#eval-trace-arrival) screen.
Find a trace by directly entering a Chat ID or Message ID. Mainly used when an admin investigates an ID that a regular user copied and forwarded.
A chat URL has the form `https:///c/{Chat ID}`. In the address bar, the UUID after `/c/` (the blue selection below) is that chat's Chat ID — copy this value. (Or obtain the Message ID that a user forwarded.)
The button shown depends on your permissions.
| Permission | Button Shown |
| ----------------------------------------- | ------------------------------------------------------------------ |
| Admin or evaluation read/write permission | **View Tracing** → navigate to Evaluation › Tracing |
| Other users | **Copy Message ID** → forward to an admin to request investigation |
Pressing **View Tracing** automatically opens the [**Evaluation › Tracing**](#eval-trace-arrival) screen.
Find a trace by directly entering a Chat ID or Message ID. Mainly used when an admin investigates an ID that a regular user copied and forwarded.
A chat URL has the form `https:///c/{Chat ID}`. In the address bar, the UUID after `/c/` (the blue selection below) is that chat's Chat ID — copy this value. (Or obtain the Message ID that a user forwarded.)
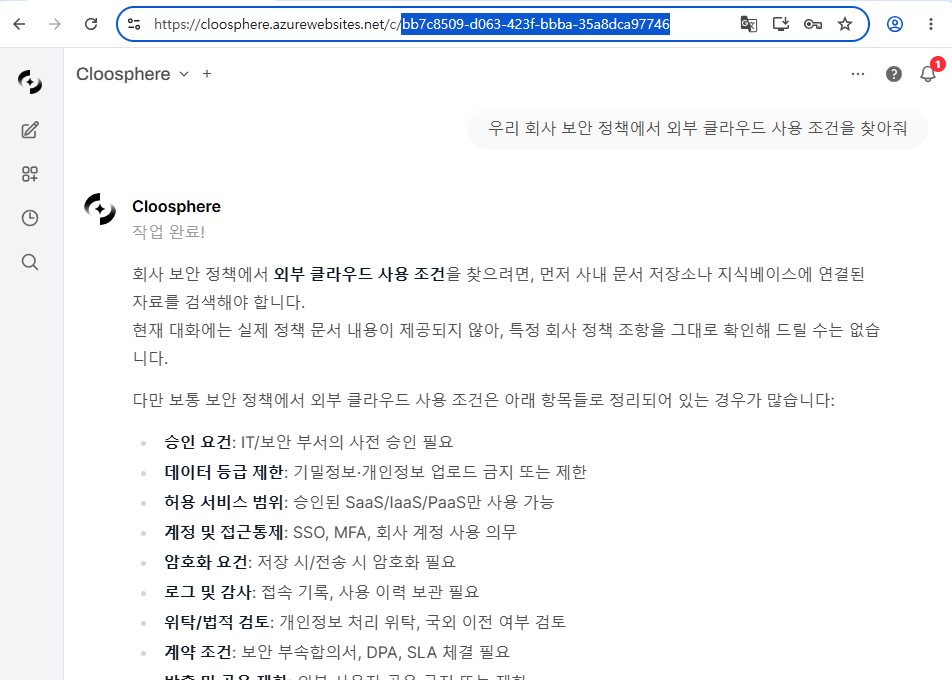 Paste it into the search box in Admin panel › [**Evaluation › Tracing**](#eval-trace-arrival) to look it up.
The Chat ID in a chat URL is held by the channel owner/user. Admins should ask the user for the URL (or a **Copy Message ID**) and investigate after receiving it.
No matter which of the three paths you enter through, the destination is a single screen: **Evaluation › Tracing** below.
Paste it into the search box in Admin panel › [**Evaluation › Tracing**](#eval-trace-arrival) to look it up.
The Chat ID in a chat URL is held by the channel owner/user. Admins should ask the user for the URL (or a **Copy Message ID**) and investigate after receiving it.
No matter which of the three paths you enter through, the destination is a single screen: **Evaluation › Tracing** below.
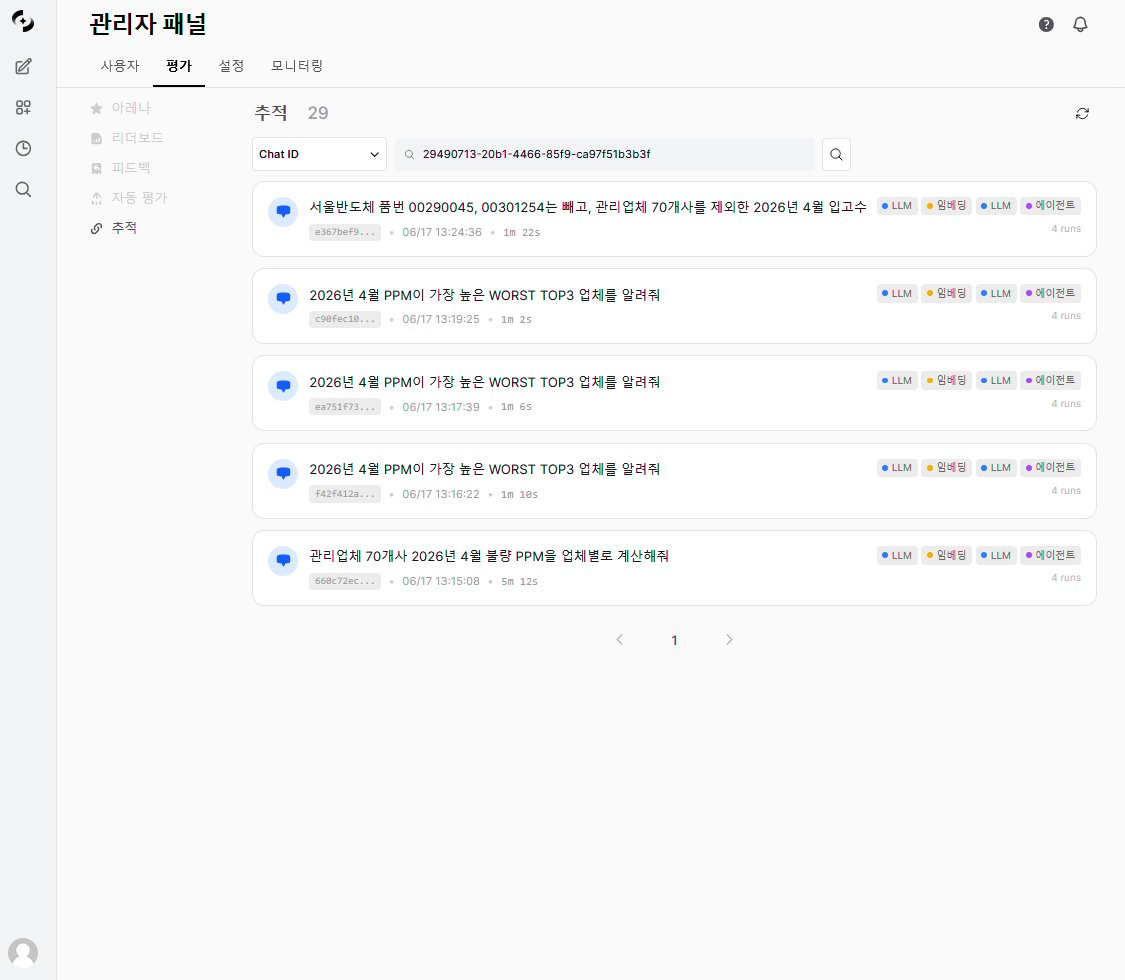 Once you arrive, pick a trace from the [search list (message cards)](#searching-traces) and open the [detail view](#how-to-read-the-trace-detail-view).
***
## Searching Traces
Searching by **Chat ID or Message ID** on the Evaluation › Tracing screen produces a **list of message cards** like the screen above.
* Each card is a summary of one user message's trace, and **clicking a card opens the [detail view](#how-to-read-the-trace-detail-view).**
The search-criteria and card-item tables are collapsed below.
| Search Criteria | Scope | Where to Get It |
| --------------- | --------------------------------- | --------------------------------------------------------- |
| **Chat ID** | All message traces in that chat | The part after `/c/` in the chat URL |
| **Message ID** | The trace of one specific message | User selects **Copy Message ID** from the message options |
Search retrieves all traces matching the entered ID with no time limit. (There are no separate filters such as date or status.)
| Card Item | Description |
| ---------------- | --------------------------------------------------------- |
| **User message** | Original input (max 2 lines) |
| **Trace ID** | Abbreviated identifier (e.g., `3fb13ae9…`) |
| **Time** | Request time (`MM/DD HH:MM:SS`) |
| **Latency** | Total processing time (seconds) |
| **Type badges** | Types of included steps — `Agent` · `LLM` · `Embed`, etc. |
| **Run count** | Number of steps (e.g., `3 runs`) |
***
## How to Read the Trace Detail View
This is the heart of tracing.
* Here you see **what steps a message went through** and **what went into and came out of** each step.
(Detailed notations such as badges and symbols are collapsed inside each tab — expand them when you encounter an unfamiliar marker.)
Once you arrive, pick a trace from the [search list (message cards)](#searching-traces) and open the [detail view](#how-to-read-the-trace-detail-view).
***
## Searching Traces
Searching by **Chat ID or Message ID** on the Evaluation › Tracing screen produces a **list of message cards** like the screen above.
* Each card is a summary of one user message's trace, and **clicking a card opens the [detail view](#how-to-read-the-trace-detail-view).**
The search-criteria and card-item tables are collapsed below.
| Search Criteria | Scope | Where to Get It |
| --------------- | --------------------------------- | --------------------------------------------------------- |
| **Chat ID** | All message traces in that chat | The part after `/c/` in the chat URL |
| **Message ID** | The trace of one specific message | User selects **Copy Message ID** from the message options |
Search retrieves all traces matching the entered ID with no time limit. (There are no separate filters such as date or status.)
| Card Item | Description |
| ---------------- | --------------------------------------------------------- |
| **User message** | Original input (max 2 lines) |
| **Trace ID** | Abbreviated identifier (e.g., `3fb13ae9…`) |
| **Time** | Request time (`MM/DD HH:MM:SS`) |
| **Latency** | Total processing time (seconds) |
| **Type badges** | Types of included steps — `Agent` · `LLM` · `Embed`, etc. |
| **Run count** | Number of steps (e.g., `3 runs`) |
***
## How to Read the Trace Detail View
This is the heart of tracing.
* Here you see **what steps a message went through** and **what went into and came out of** each step.
(Detailed notations such as badges and symbols are collapsed inside each tab — expand them when you encounter an unfamiliar marker.)
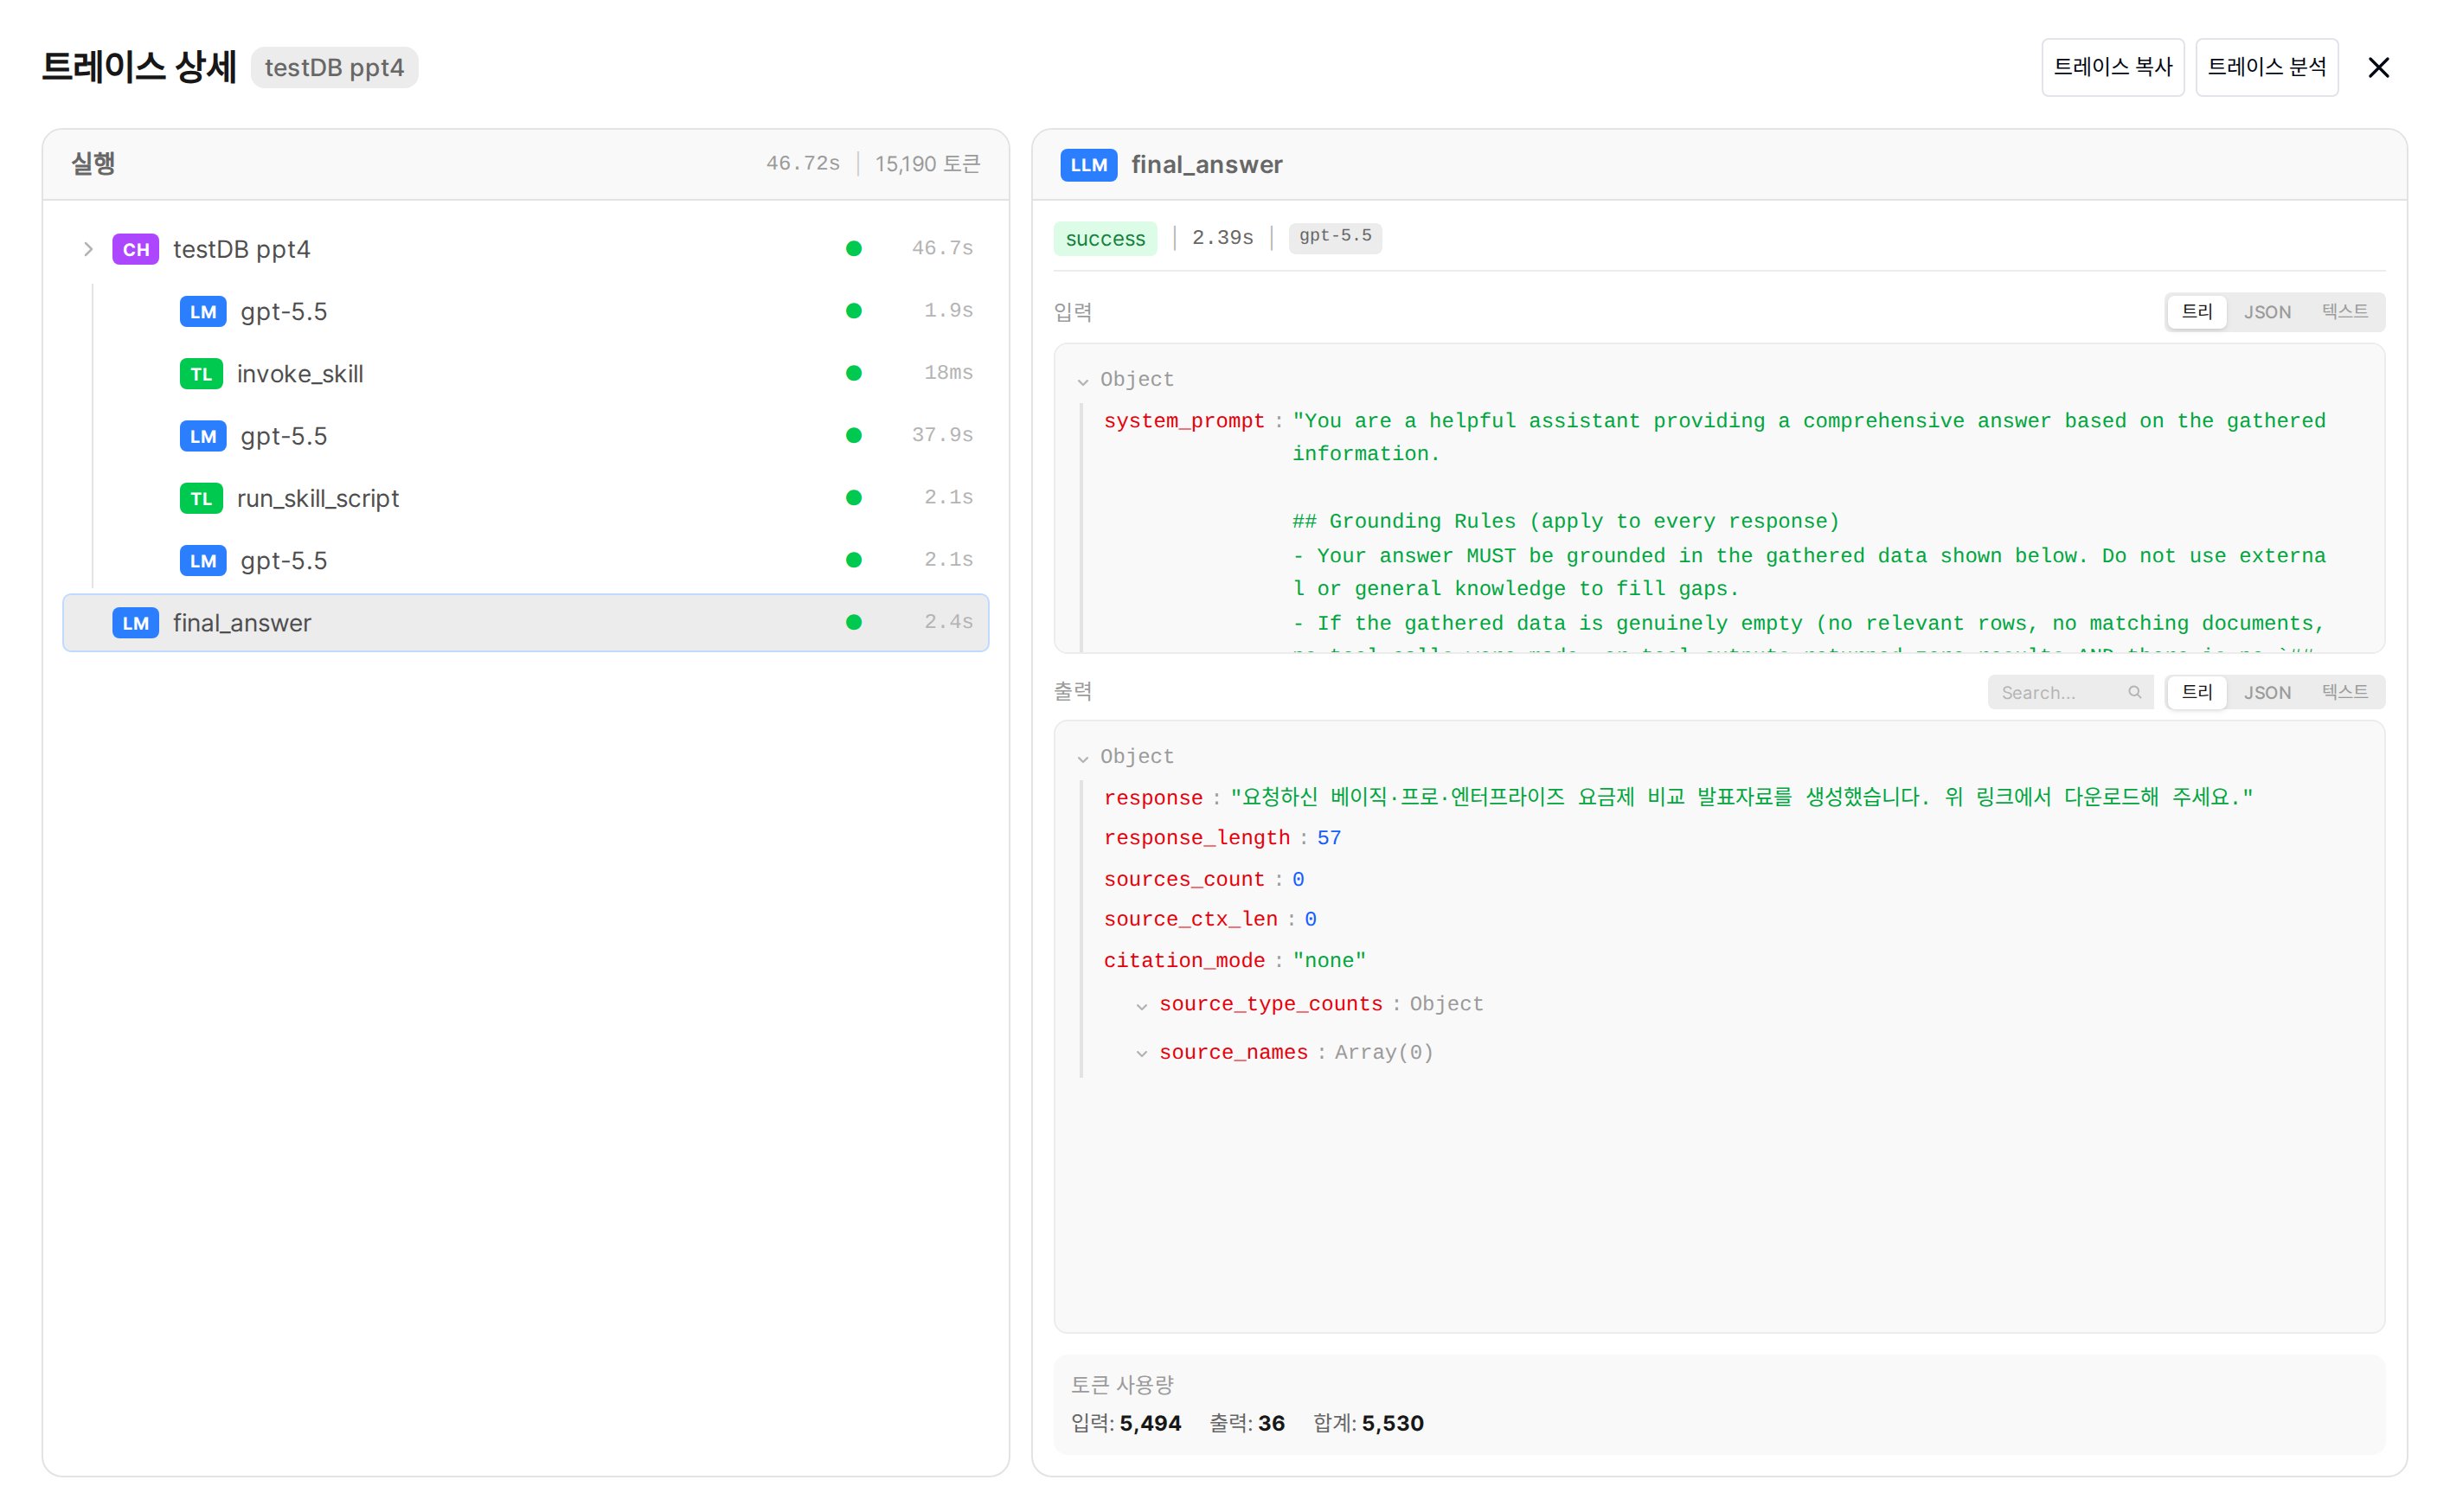 The screen is split into the **left Run tree** (lists processing steps in order and hierarchy, with total latency and total tokens at the top) and the **right detail panel** (inputs, outputs, and tokens of the selected step).
A single message typically goes like this — the agent (`CH`) repeats `LM` reasoning and tool calls to gather data, and finally `final_answer` (`LM`) writes the answer.
Each line (Run) is shown as **colored badge + name + ● status + latency**. Knowing just the frequently seen badges is enough to read the tree. (For the full list including colors, expand the legend below.)
| Badge | What It Does |
| :-----: | ----------------------------------------------------------------------------------------------------- |
| **CH** | Agent run — the step wrapping the entire message processing (name is the agent name, e.g., `dv_test`) |
| **LM** | LLM call — reasoning or writing the final answer (`final_answer`) |
| **TL** | Tool execution — SQL queries, function calls (`run_sql_read`, etc.) |
| **EM** | Embedding — generating vectors for search |
| **ACT** | Action group — tool + sub-steps bundle (expand with the arrow) |
* **● Status** — green means OK, red means an error at that step.
* **Adjacent time** — that step's latency. The step with the largest value is the bottleneck.
Auxiliary tasks such as auto-generating the title, tags, and search query are recorded separately from the response in the `background_tasks` trace.
The detail tree distinguishes step types by colored badges. (On search-result cards, they are grouped under labels like `Agent` · `LLM` · `Embed`.)
| Badge | Type | Color | Description |
| :-----: | ---------- | :----: | ---------------------------------------------------- |
| **CH** | Chain | Purple | Composite work — full message processing / agent run |
| **LM** | LLM | Blue | LLM call (reasoning, final answer) |
| **TL** | Tool | Green | Tool execution (SQL, functions, etc.) |
| **RG** | Retrieval | Orange | Knowledge Base document search |
| **WB** | Web Search | Cyan | Web search |
| **GD** | Guardrail | Red | Guardrail check |
| **EM** | Embedding | Yellow | Embedding (vector) generation |
| **FL** | Filter | Pink | Filter function execution |
| **PP** | Pipeline | Navy | Pipeline processing |
| **TK** | Task | Gray | Background task |
| **IM** | Image | Gray | Image generation (no dedicated color, gray) |
| **ACT** | Action | Purple | Tool + sub-step group (expandable, synthetic badge) |
| Status | Symbol | Color |
| ----------- | :----: | :----: |
| **Success** | ● | Green |
| **Error** | ● | Red |
| **Running** | ◐ | Yellow |
| **Pending** | ○ | Gray |
The trace's overall status is **Error if any included Run is Error**; if there's no Error but a Running exists, it shows as Running.
Clicking a step in the tree shows that step's details on the right.
| Section | Content |
| --------------- | -------------------------------------------------------------------------------- |
| **Top summary** | Status · latency · model used |
| **Inputs** | Input (system prompt, normalized question, etc.) |
| **Outputs** | Output (response, retrieved source count `sources_count` · `source_names`, etc.) |
| **Token Usage** | **Input · Output · Total** tokens |
* The **Tree · JSON · Text** toggle switches inputs/outputs between tree, raw JSON, and plain text.
* The **Search…** box in Outputs lets you find text within long output.
| View Mode | Description |
| --------- | --------------------------- |
| **Tree** | Hierarchical tree (default) |
| **JSON** | Raw JSON |
| **Text** | Plain text |
Text search works in the Outputs area. Entering a query highlights matches; **Enter** moves to the next match and **Shift+Enter** to the previous one, and the match count is shown next to the search box like `1/5`.
### Reading in Two Phases
Reading the agent's response in **two phases** helps you find the cause quickly.
```mermaid theme={null}
flowchart TD
A["CH agent run — Phase 1: data collection"] --> B["LM reasoning — decide which tool to use"]
B --> C["TL run_sql_read — DB query"]
B --> D["TL get_table_details — check schema"]
B --> E["LM reasoning — decide next step"]
A --> F["LM final_answer — Phase 2: write final answer"]
```
| Phase | What | What to Look At |
| :---------: | --------------------------------------------------------------------- | ------------------------------------------------------------- |
| **Phase 1** | The agent (`CH`) calls tools (`TL`) via `LM` reasoning to gather data | Which tools were used, whether results were non-empty |
| **Phase 2** | `final_answer` (`LM`) writes the answer from the gathered data | Whether the gathered data is properly reflected in the answer |
### Debugging Points
Check `active_capabilities` (tools/features available at that moment) in the Inputs of Phase 1's **LM reasoning Run**.
* **Desired tool not in the list** → that feature (Knowledge Base, DB, etc.) isn't connected to the agent
* **Tool present but not called** → the model judged low relevance between the question and the tool. Make the tool/feature description more specific
Check `sources_count` and `source_names` in the Outputs of the `final_answer` (**LM**) Run. (Search results are contained in this output, not in a separate Run.)
* **`sources_count` is 0** → zero search results. A KB document is missing, or search settings (Top K, Reranker, etc.) need review
* **Sources exist but the answer is off** → check what was passed in the same Run's Inputs and adjust the answer prompt
Click the **TL (Tool) Run** marked with a red ● and check both the error content in Outputs and the parameters passed in Inputs.
Compare the latency next to each step in the Run tree. The longest step is the bottleneck.
* **LM** slow → consider switching to a faster model
* **TL/EM** slow → check tool/search settings or external services
* **GD** (guardrail) slow → disable LLM judgment or switch to a faster model
## Trace Analysis Report
A feature that analyzes trace data with an LLM to **automatically identify the root cause of a problem**.
Click the **Trace Analysis** (Analyze Trace) button at the top of the trace detail modal.
| Input | Description | Required |
| ----------------------- | ----------------------------------- | :------: |
| **Analysis model** | LLM model used for analysis | Required |
| **Problem description** | Description of the observed problem | Optional |
The analysis model list excludes models with base\_model\_id (custom models), preset models, and arena models. Only base models are selectable.
The LLM comprehensively analyzes trace data + agent settings + conversation history + KB/DB/guardrail settings to generate a structured report.
| Report Section | Content |
| ------------------------------- | ----------------------------------------------------------------------- |
| **Summary** | 2\~3 sentence core summary of the analysis |
| **Trace overview** | ID, status, latency, tokens, Run count, error count |
| **Root cause analysis** | Primary cause + contributing factors |
| **Phase 1 analysis** | Whether tool selection was appropriate, available vs. actual tool calls |
| **Phase 2 analysis** | Appropriateness of the final answer relative to collected data |
| **Prompt/setting issues** | System prompt, model selection issues |
| **KB/RAG issues** | Search settings, document quality, filter issues |
| **DB/SQL issues** | NL-to-SQL conversion, schema issues |
| **Guardrail issues** | Excessive blocking, false positives |
| **Error analysis** | Error Run detailed diagnosis |
| **Improvement recommendations** | Immediate actions, setting changes, data improvements |
Entering a problem description enables analysis focused on that context. Example: "KB found documents but they weren't reflected in the answer"
| Feature | Description |
| ------------ | ------------------------------- |
| **Copy** | Copy full text to clipboard |
| **Download** | Download as markdown file (.md) |
When a previously analyzed report exists, the **"View Report"** button shows it directly without re-analysis.
***
## Trace Management
### Permissions
| Role | Permission |
| ---------------- | ----------------------------------- |
| **Regular user** | Can only view own traces |
| **Admin** | View and manage traces of all users |
### Data Cleanup
Old traces are cleaned up via the `/api/traces/cleanup` **developer API**.
* Bulk-delete traces before a specific timestamp (in milliseconds, ms).
Trace deletion is irreversible. Download necessary analysis reports before deleting.
***
## Use Cases
1. Click the **View Tracing** button on a chat message
2. Select the `final_answer` (**LM**) step in the left Run tree
3. In **Outputs**, check `sources_count` · `source_names` to see whether search results were reflected
4. In **Inputs**, check what was passed to the model
5. Generate a **Trace Analysis Report** to auto-identify the root cause
1. Open the trace of a slow response
2. Compare the latency next to each step in the Run tree
3. Identify the longest step (e.g., tool 0.8s, LLM 3.2s)
4. Optimize that step (adjust search settings, change the model, etc.)
1. Open the suspected trace
2. Select the **TL (Tool) Run** marked with a red ●
3. Check the error content in **Outputs**
4. Verify the passed parameters in **Inputs**
1. Check overall trace usage via **total tokens** at the top of the detail view
2. Compare per-LM Run **Token Usage** (Input/Output/Total) in the Run tree
3. Check the token ratio of Phase 1 (agent run) vs. Phase 2 (`final_answer`)
4. Identify unnecessarily large prompts or repeated calls
***
## FAQ
Yes — when message tracing is enabled (default: enabled), all AI requests are auto-recorded. No additional setup needed.
Default retention is **30 days**. Admins can change settings or manually clean up.
Trace recording is asynchronously processed in the background, so it has nearly no impact on response speed.
Yes — trace analysis is a separate LLM call, tracked in usage as `trace_analysis`. Analysis only runs when manually triggered.
***
## Related Pages
Dedicated log for guardrail detection events
Automatic evaluation results for agent response quality
Token usage and cost analysis
The screen is split into the **left Run tree** (lists processing steps in order and hierarchy, with total latency and total tokens at the top) and the **right detail panel** (inputs, outputs, and tokens of the selected step).
A single message typically goes like this — the agent (`CH`) repeats `LM` reasoning and tool calls to gather data, and finally `final_answer` (`LM`) writes the answer.
Each line (Run) is shown as **colored badge + name + ● status + latency**. Knowing just the frequently seen badges is enough to read the tree. (For the full list including colors, expand the legend below.)
| Badge | What It Does |
| :-----: | ----------------------------------------------------------------------------------------------------- |
| **CH** | Agent run — the step wrapping the entire message processing (name is the agent name, e.g., `dv_test`) |
| **LM** | LLM call — reasoning or writing the final answer (`final_answer`) |
| **TL** | Tool execution — SQL queries, function calls (`run_sql_read`, etc.) |
| **EM** | Embedding — generating vectors for search |
| **ACT** | Action group — tool + sub-steps bundle (expand with the arrow) |
* **● Status** — green means OK, red means an error at that step.
* **Adjacent time** — that step's latency. The step with the largest value is the bottleneck.
Auxiliary tasks such as auto-generating the title, tags, and search query are recorded separately from the response in the `background_tasks` trace.
The detail tree distinguishes step types by colored badges. (On search-result cards, they are grouped under labels like `Agent` · `LLM` · `Embed`.)
| Badge | Type | Color | Description |
| :-----: | ---------- | :----: | ---------------------------------------------------- |
| **CH** | Chain | Purple | Composite work — full message processing / agent run |
| **LM** | LLM | Blue | LLM call (reasoning, final answer) |
| **TL** | Tool | Green | Tool execution (SQL, functions, etc.) |
| **RG** | Retrieval | Orange | Knowledge Base document search |
| **WB** | Web Search | Cyan | Web search |
| **GD** | Guardrail | Red | Guardrail check |
| **EM** | Embedding | Yellow | Embedding (vector) generation |
| **FL** | Filter | Pink | Filter function execution |
| **PP** | Pipeline | Navy | Pipeline processing |
| **TK** | Task | Gray | Background task |
| **IM** | Image | Gray | Image generation (no dedicated color, gray) |
| **ACT** | Action | Purple | Tool + sub-step group (expandable, synthetic badge) |
| Status | Symbol | Color |
| ----------- | :----: | :----: |
| **Success** | ● | Green |
| **Error** | ● | Red |
| **Running** | ◐ | Yellow |
| **Pending** | ○ | Gray |
The trace's overall status is **Error if any included Run is Error**; if there's no Error but a Running exists, it shows as Running.
Clicking a step in the tree shows that step's details on the right.
| Section | Content |
| --------------- | -------------------------------------------------------------------------------- |
| **Top summary** | Status · latency · model used |
| **Inputs** | Input (system prompt, normalized question, etc.) |
| **Outputs** | Output (response, retrieved source count `sources_count` · `source_names`, etc.) |
| **Token Usage** | **Input · Output · Total** tokens |
* The **Tree · JSON · Text** toggle switches inputs/outputs between tree, raw JSON, and plain text.
* The **Search…** box in Outputs lets you find text within long output.
| View Mode | Description |
| --------- | --------------------------- |
| **Tree** | Hierarchical tree (default) |
| **JSON** | Raw JSON |
| **Text** | Plain text |
Text search works in the Outputs area. Entering a query highlights matches; **Enter** moves to the next match and **Shift+Enter** to the previous one, and the match count is shown next to the search box like `1/5`.
### Reading in Two Phases
Reading the agent's response in **two phases** helps you find the cause quickly.
```mermaid theme={null}
flowchart TD
A["CH agent run — Phase 1: data collection"] --> B["LM reasoning — decide which tool to use"]
B --> C["TL run_sql_read — DB query"]
B --> D["TL get_table_details — check schema"]
B --> E["LM reasoning — decide next step"]
A --> F["LM final_answer — Phase 2: write final answer"]
```
| Phase | What | What to Look At |
| :---------: | --------------------------------------------------------------------- | ------------------------------------------------------------- |
| **Phase 1** | The agent (`CH`) calls tools (`TL`) via `LM` reasoning to gather data | Which tools were used, whether results were non-empty |
| **Phase 2** | `final_answer` (`LM`) writes the answer from the gathered data | Whether the gathered data is properly reflected in the answer |
### Debugging Points
Check `active_capabilities` (tools/features available at that moment) in the Inputs of Phase 1's **LM reasoning Run**.
* **Desired tool not in the list** → that feature (Knowledge Base, DB, etc.) isn't connected to the agent
* **Tool present but not called** → the model judged low relevance between the question and the tool. Make the tool/feature description more specific
Check `sources_count` and `source_names` in the Outputs of the `final_answer` (**LM**) Run. (Search results are contained in this output, not in a separate Run.)
* **`sources_count` is 0** → zero search results. A KB document is missing, or search settings (Top K, Reranker, etc.) need review
* **Sources exist but the answer is off** → check what was passed in the same Run's Inputs and adjust the answer prompt
Click the **TL (Tool) Run** marked with a red ● and check both the error content in Outputs and the parameters passed in Inputs.
Compare the latency next to each step in the Run tree. The longest step is the bottleneck.
* **LM** slow → consider switching to a faster model
* **TL/EM** slow → check tool/search settings or external services
* **GD** (guardrail) slow → disable LLM judgment or switch to a faster model
## Trace Analysis Report
A feature that analyzes trace data with an LLM to **automatically identify the root cause of a problem**.
Click the **Trace Analysis** (Analyze Trace) button at the top of the trace detail modal.
| Input | Description | Required |
| ----------------------- | ----------------------------------- | :------: |
| **Analysis model** | LLM model used for analysis | Required |
| **Problem description** | Description of the observed problem | Optional |
The analysis model list excludes models with base\_model\_id (custom models), preset models, and arena models. Only base models are selectable.
The LLM comprehensively analyzes trace data + agent settings + conversation history + KB/DB/guardrail settings to generate a structured report.
| Report Section | Content |
| ------------------------------- | ----------------------------------------------------------------------- |
| **Summary** | 2\~3 sentence core summary of the analysis |
| **Trace overview** | ID, status, latency, tokens, Run count, error count |
| **Root cause analysis** | Primary cause + contributing factors |
| **Phase 1 analysis** | Whether tool selection was appropriate, available vs. actual tool calls |
| **Phase 2 analysis** | Appropriateness of the final answer relative to collected data |
| **Prompt/setting issues** | System prompt, model selection issues |
| **KB/RAG issues** | Search settings, document quality, filter issues |
| **DB/SQL issues** | NL-to-SQL conversion, schema issues |
| **Guardrail issues** | Excessive blocking, false positives |
| **Error analysis** | Error Run detailed diagnosis |
| **Improvement recommendations** | Immediate actions, setting changes, data improvements |
Entering a problem description enables analysis focused on that context. Example: "KB found documents but they weren't reflected in the answer"
| Feature | Description |
| ------------ | ------------------------------- |
| **Copy** | Copy full text to clipboard |
| **Download** | Download as markdown file (.md) |
When a previously analyzed report exists, the **"View Report"** button shows it directly without re-analysis.
***
## Trace Management
### Permissions
| Role | Permission |
| ---------------- | ----------------------------------- |
| **Regular user** | Can only view own traces |
| **Admin** | View and manage traces of all users |
### Data Cleanup
Old traces are cleaned up via the `/api/traces/cleanup` **developer API**.
* Bulk-delete traces before a specific timestamp (in milliseconds, ms).
Trace deletion is irreversible. Download necessary analysis reports before deleting.
***
## Use Cases
1. Click the **View Tracing** button on a chat message
2. Select the `final_answer` (**LM**) step in the left Run tree
3. In **Outputs**, check `sources_count` · `source_names` to see whether search results were reflected
4. In **Inputs**, check what was passed to the model
5. Generate a **Trace Analysis Report** to auto-identify the root cause
1. Open the trace of a slow response
2. Compare the latency next to each step in the Run tree
3. Identify the longest step (e.g., tool 0.8s, LLM 3.2s)
4. Optimize that step (adjust search settings, change the model, etc.)
1. Open the suspected trace
2. Select the **TL (Tool) Run** marked with a red ●
3. Check the error content in **Outputs**
4. Verify the passed parameters in **Inputs**
1. Check overall trace usage via **total tokens** at the top of the detail view
2. Compare per-LM Run **Token Usage** (Input/Output/Total) in the Run tree
3. Check the token ratio of Phase 1 (agent run) vs. Phase 2 (`final_answer`)
4. Identify unnecessarily large prompts or repeated calls
***
## FAQ
Yes — when message tracing is enabled (default: enabled), all AI requests are auto-recorded. No additional setup needed.
Default retention is **30 days**. Admins can change settings or manually clean up.
Trace recording is asynchronously processed in the background, so it has nearly no impact on response speed.
Yes — trace analysis is a separate LLM call, tracked in usage as `trace_analysis`. Analysis only runs when manually triggered.
***
## Related Pages
Dedicated log for guardrail detection events
Automatic evaluation results for agent response quality
Token usage and cost analysis