> ## Documentation Index
> Fetch the complete documentation index at: https://docs.cloosphere.ai/llms.txt
> Use this file to discover all available pages before exploring further.
# Usage
> Track and analyze token usage and API request count by model/user/team
Admin › Monitoring › Usage
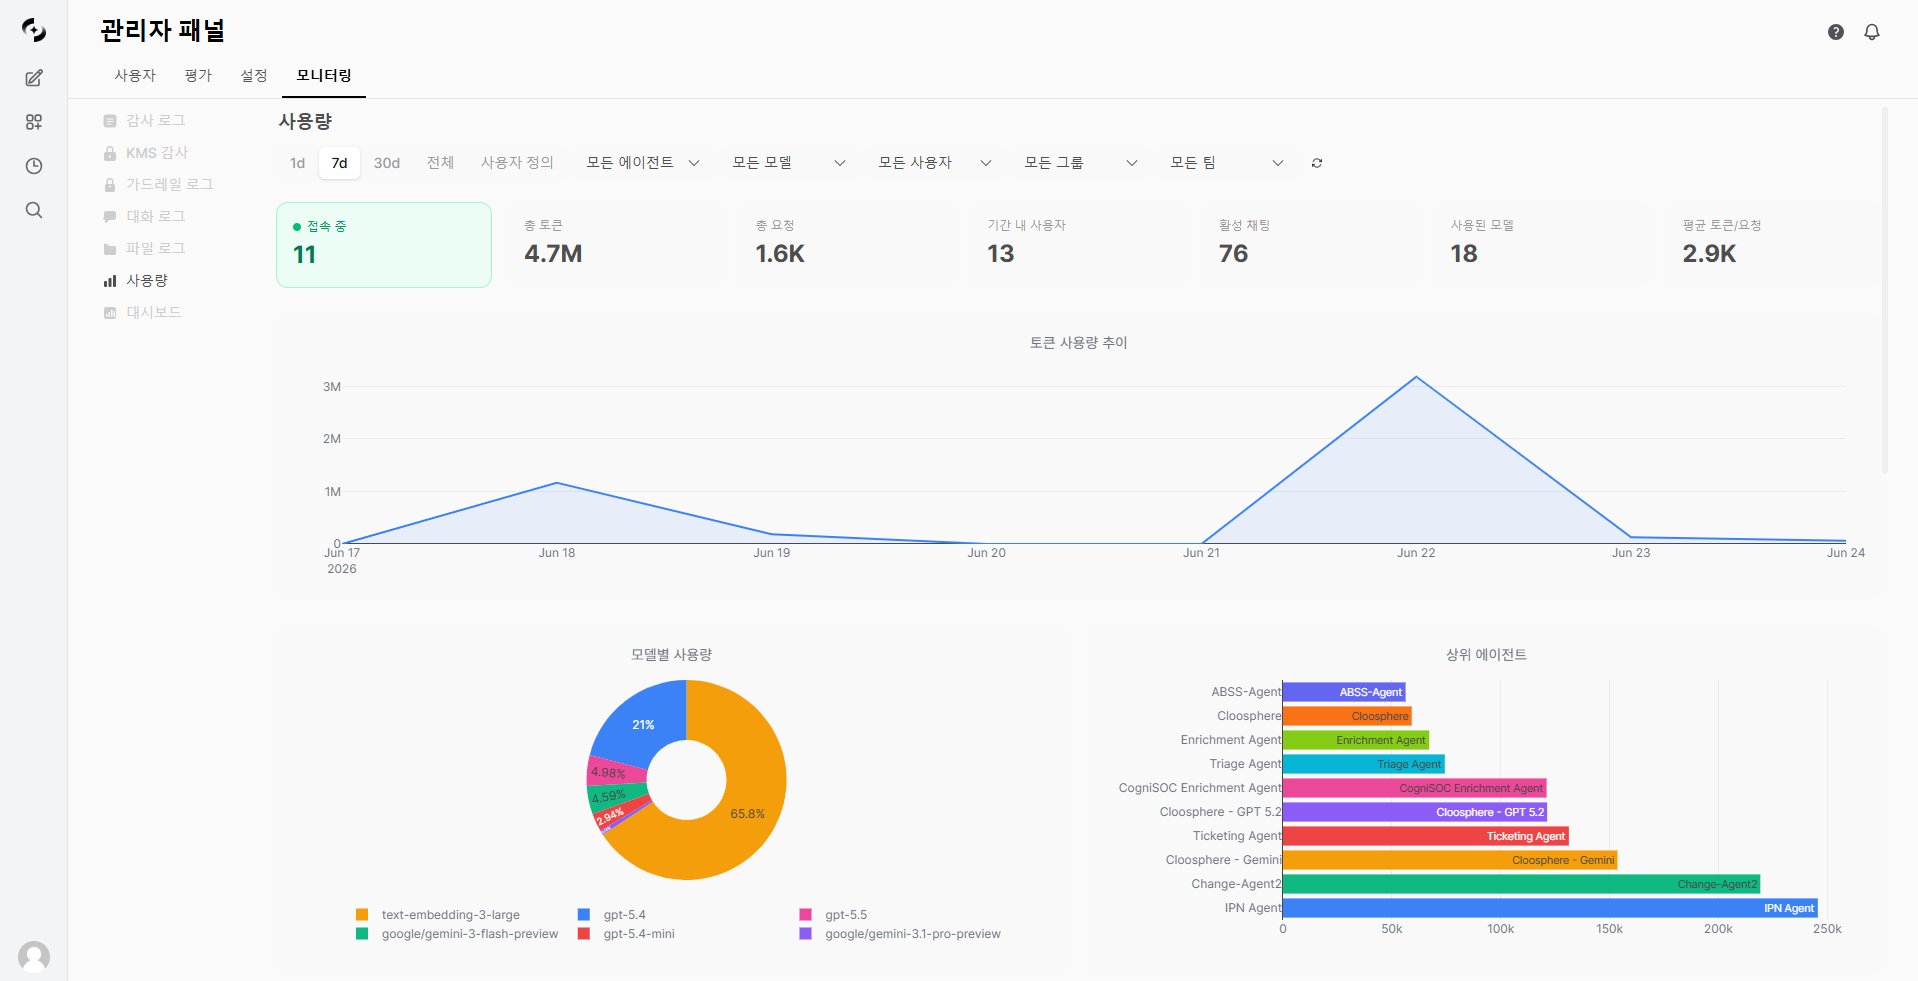
The usage dashboard **visualizes AI resource consumption in real time**.
* Analyze token usage and request count across multiple dimensions (model, user, agent, group, team).
 ***
## Key Metrics
Key metrics appear at the top of the dashboard as cards.
| Metric | Description |
| ---------------------- | -------------------------------------- |
| **Online** | Currently connected users (real-time) |
| **Total Tokens** | All tokens used in the selected period |
| **Total Requests** | API call count |
| **Active Users** | Active users in the period |
| **Active Chats** | Active chat sessions in the period |
| **Models Used** | Number of model types used |
| **Avg Tokens/Request** | Average token consumption per request |
If average tokens/request is abnormally high, excessive system prompts or unnecessary context may be included. Review agent settings.
***
## Usage Trend Chart
Visualize usage over time as a line chart.
***
## Key Metrics
Key metrics appear at the top of the dashboard as cards.
| Metric | Description |
| ---------------------- | -------------------------------------- |
| **Online** | Currently connected users (real-time) |
| **Total Tokens** | All tokens used in the selected period |
| **Total Requests** | API call count |
| **Active Users** | Active users in the period |
| **Active Chats** | Active chat sessions in the period |
| **Models Used** | Number of model types used |
| **Avg Tokens/Request** | Average token consumption per request |
If average tokens/request is abnormally high, excessive system prompts or unnecessary context may be included. Review agent settings.
***
## Usage Trend Chart
Visualize usage over time as a line chart.
 ### Period Selection
| Period | Description |
| ---------- | ------------------------ |
| **1d** | Last 1 day |
| **7d** | Last 7 days |
| **30d** | Last 30 days |
| **All** | Entire period |
| **Custom** | Pick date range directly |
### Chart Metric
The chart shows **token usage trend** as a line graph.
| Metric | Description |
| ---------- | ------------------------- |
| **Tokens** | Total token usage by date |
***
## Multi-dimensional Analysis
Break usage down by model, user, agent, group, and team.
* All charts respond to the top filters (period, model, user, group, team, agent).
### Period Selection
| Period | Description |
| ---------- | ------------------------ |
| **1d** | Last 1 day |
| **7d** | Last 7 days |
| **30d** | Last 30 days |
| **All** | Entire period |
| **Custom** | Pick date range directly |
### Chart Metric
The chart shows **token usage trend** as a line graph.
| Metric | Description |
| ---------- | ------------------------- |
| **Tokens** | Total token usage by date |
***
## Multi-dimensional Analysis
Break usage down by model, user, agent, group, and team.
* All charts respond to the top filters (period, model, user, group, team, agent).
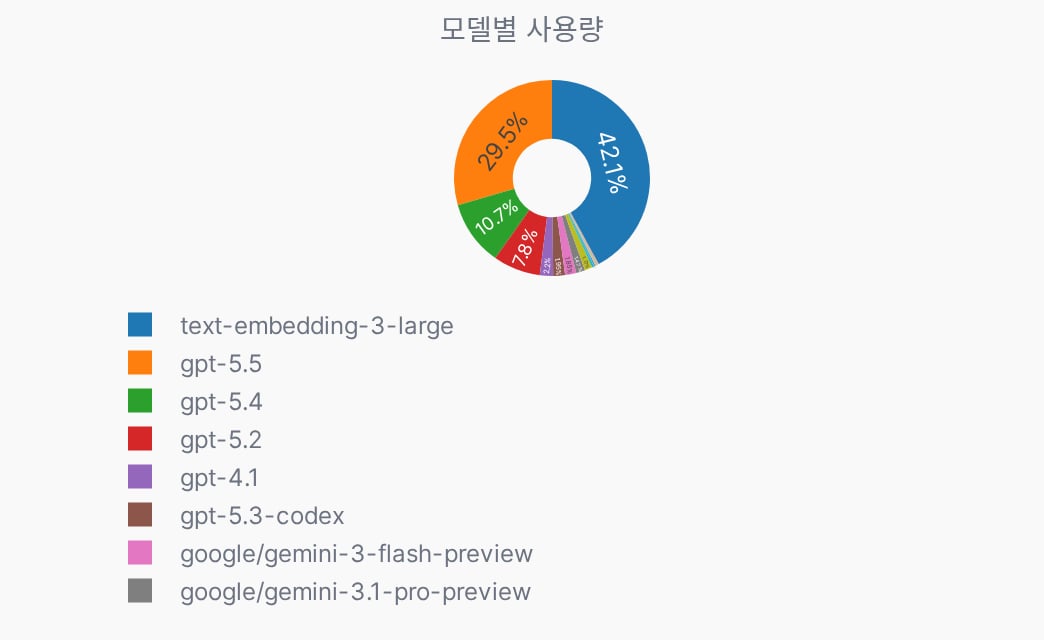 Check how much each AI model is used, by token share.
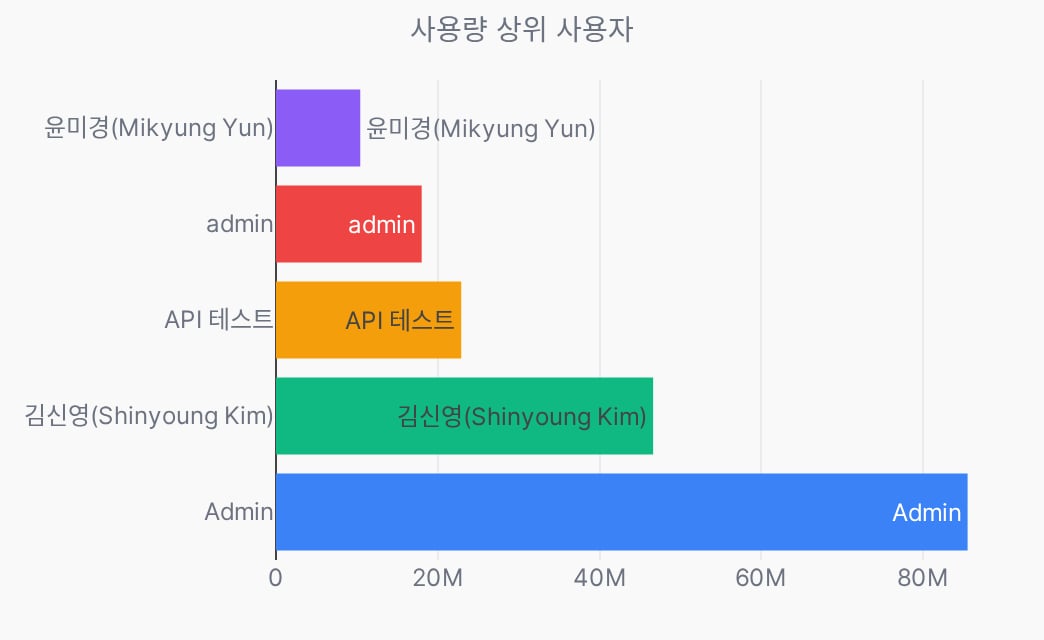 Ranks users by token usage.
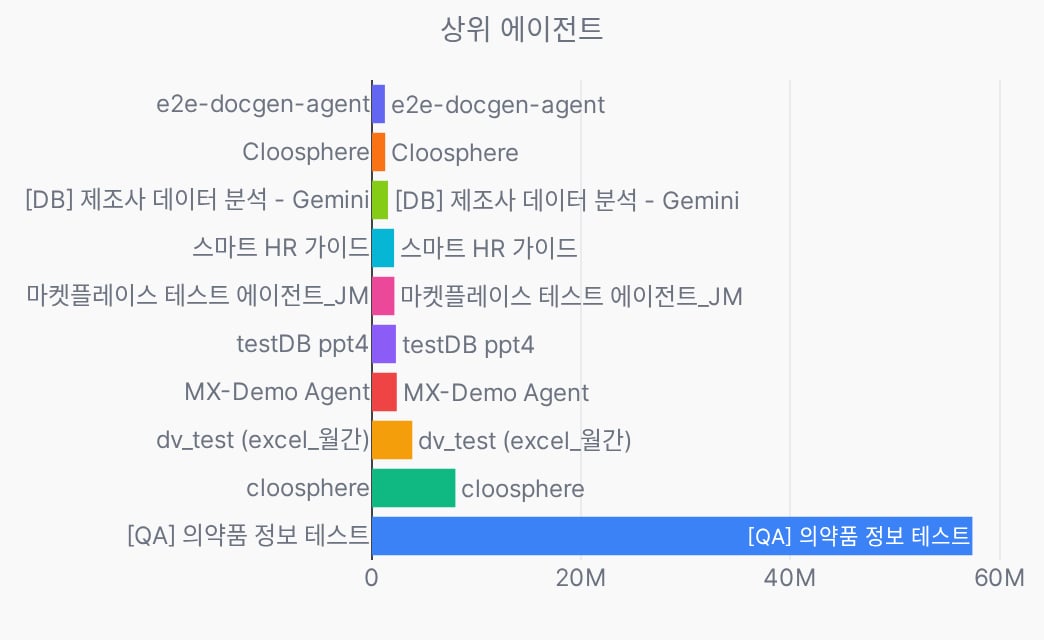 Ranks workspace agents by token usage.
Compare agents to identify inefficient ones and optimize prompts.
Ranks workspace agents by token usage.
Compare agents to identify inefficient ones and optimize prompts.
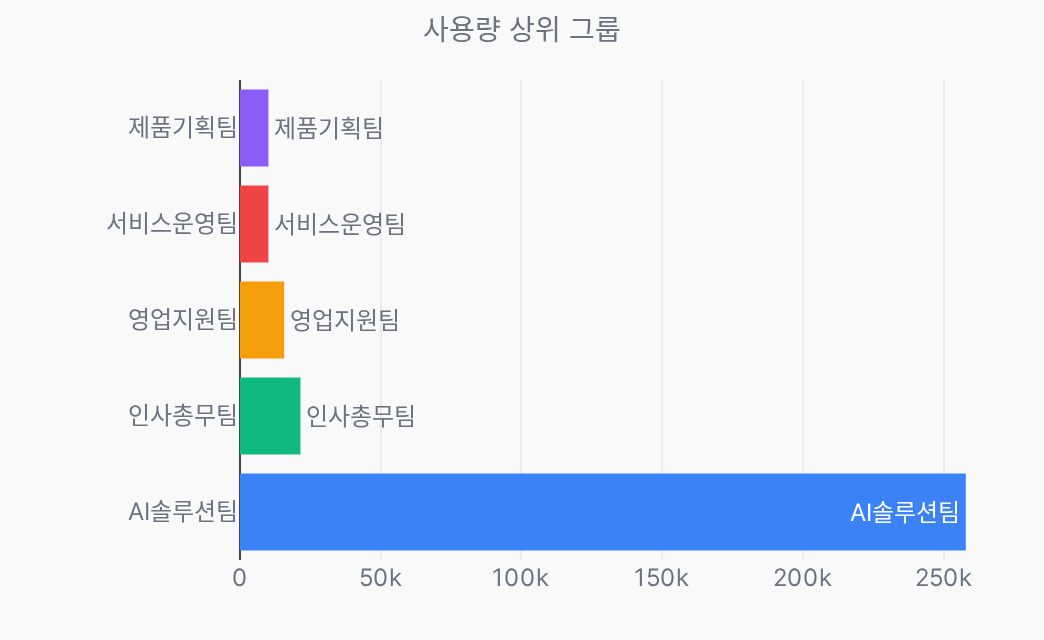 Ranks permission groups by token usage. When there is no usage in the selected period, it shows "No group usage data".
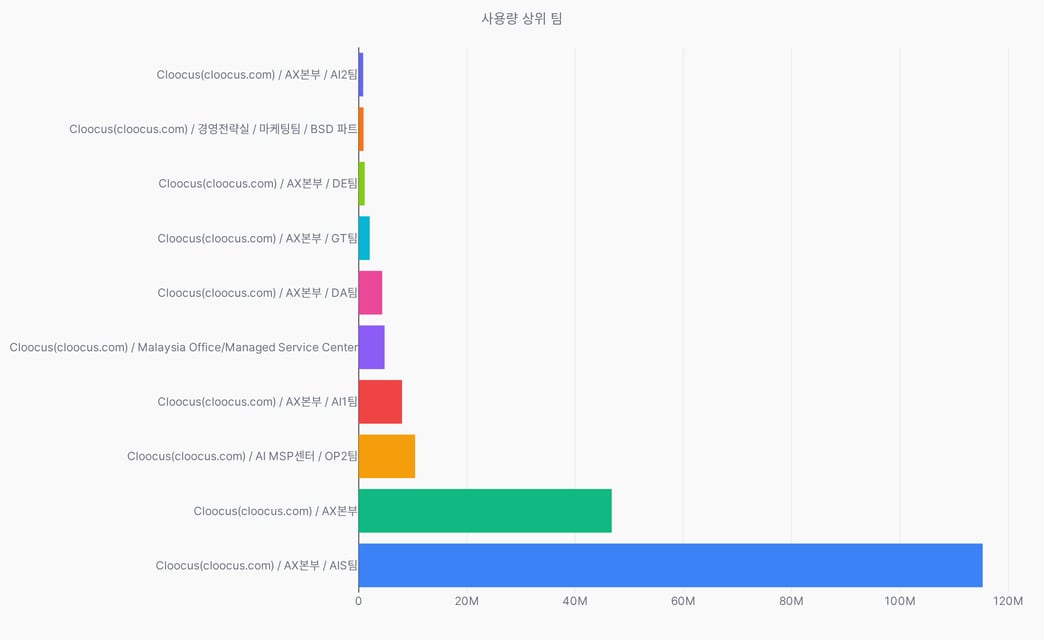 Ranks Teams by token usage.
***
## Usage Type Classification
Classify what work tokens were used for.
* The chart shows **only types with usage records in the selected period**.
Ranks Teams by token usage.
***
## Usage Type Classification
Classify what work tokens were used for.
* The chart shows **only types with usage records in the selected period**.
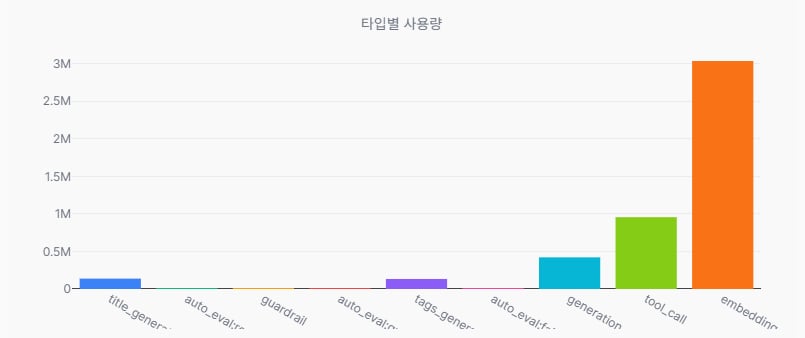 Only types with **actual activity in the period** appear in the chart.
**User activity (counts toward the daily limit)**
| Type | Description |
| ----------------------------- | ------------------------------------------- |
| **chat** | Standard chat response generation |
| **generation** | Agent/RAG response generation |
| **agent\_state** | Agent state / next-step decision |
| **reasoning** | Reasoning step |
| **tool\_call** | Tool invocation |
| **function\_calling** | Function call |
| **embedding** | Document/search embedding |
| **image\_generation** | Image generation |
| **code\_gateway** | Code Gateway execution |
| **moa\_response\_generation** | MoA (Mixture-of-Agents) response generation |
**Background tasks (not counted toward the limit)**
| Type | Description |
| ----------------------------- | ---------------------------------- |
| **title\_generation** | Chat title auto-generation |
| **tags\_generation** | Chat tag auto-generation |
| **emoji\_generation** | Chat emoji auto-generation |
| **query\_generation** | Search query generation |
| **image\_prompt\_generation** | Image-generation prompt enrichment |
| **autocomplete\_generation** | Input autocomplete suggestion |
| **follow\_up\_generation** | Follow-up question suggestion |
**System / monitoring**
| Type | Description |
| ------------------------------------------------- | -------------------------------------------- |
| **guardrail** | Guardrail LLM judgment |
| **schema\_extraction** | Structured data (schema) extraction |
| **scheduled\_task** | Scheduled task execution |
| **trace\_analysis** | Trace analysis report generation |
| **external\_service** | Direct gateway call to an external service |
| **auto\_eval:{retrieval, faithfulness, quality}** | Auto-evaluation LLM judgment (per eval type) |
***
## Filtering
Combine multiple conditions to filter data.
* All filters apply simultaneously.
| Filter | Description |
| ---------- | --------------------- |
| **Period** | Start/end date range |
| **Model** | Pick a specific model |
| **User** | Pick a specific user |
| **Group** | Pick a specific group |
| **Team** | Pick a specific team |
| **Agent** | Pick a specific agent |
Filter dropdowns only show items with actual usage records.
Individual conversation details are available in a separate **Monitoring > Conversation Logs** tab.
***
## Related Pages
Configure usage limits and excess actions
Track per-request token usage
Review response quality evaluation results
Only types with **actual activity in the period** appear in the chart.
**User activity (counts toward the daily limit)**
| Type | Description |
| ----------------------------- | ------------------------------------------- |
| **chat** | Standard chat response generation |
| **generation** | Agent/RAG response generation |
| **agent\_state** | Agent state / next-step decision |
| **reasoning** | Reasoning step |
| **tool\_call** | Tool invocation |
| **function\_calling** | Function call |
| **embedding** | Document/search embedding |
| **image\_generation** | Image generation |
| **code\_gateway** | Code Gateway execution |
| **moa\_response\_generation** | MoA (Mixture-of-Agents) response generation |
**Background tasks (not counted toward the limit)**
| Type | Description |
| ----------------------------- | ---------------------------------- |
| **title\_generation** | Chat title auto-generation |
| **tags\_generation** | Chat tag auto-generation |
| **emoji\_generation** | Chat emoji auto-generation |
| **query\_generation** | Search query generation |
| **image\_prompt\_generation** | Image-generation prompt enrichment |
| **autocomplete\_generation** | Input autocomplete suggestion |
| **follow\_up\_generation** | Follow-up question suggestion |
**System / monitoring**
| Type | Description |
| ------------------------------------------------- | -------------------------------------------- |
| **guardrail** | Guardrail LLM judgment |
| **schema\_extraction** | Structured data (schema) extraction |
| **scheduled\_task** | Scheduled task execution |
| **trace\_analysis** | Trace analysis report generation |
| **external\_service** | Direct gateway call to an external service |
| **auto\_eval:{retrieval, faithfulness, quality}** | Auto-evaluation LLM judgment (per eval type) |
***
## Filtering
Combine multiple conditions to filter data.
* All filters apply simultaneously.
| Filter | Description |
| ---------- | --------------------- |
| **Period** | Start/end date range |
| **Model** | Pick a specific model |
| **User** | Pick a specific user |
| **Group** | Pick a specific group |
| **Team** | Pick a specific team |
| **Agent** | Pick a specific agent |
Filter dropdowns only show items with actual usage records.
Individual conversation details are available in a separate **Monitoring > Conversation Logs** tab.
***
## Related Pages
Configure usage limits and excess actions
Track per-request token usage
Review response quality evaluation results