> ## Documentation Index
> Fetch the complete documentation index at: https://docs.cloosphere.ai/llms.txt
> Use this file to discover all available pages before exploring further.
# 모니터링
> OpenTelemetry를 활성화하고, 외부 관측성 스택(Prometheus · Grafana · Loki) 배포 패키지를 내려받습니다.
관리자 › 설정 › 모니터링
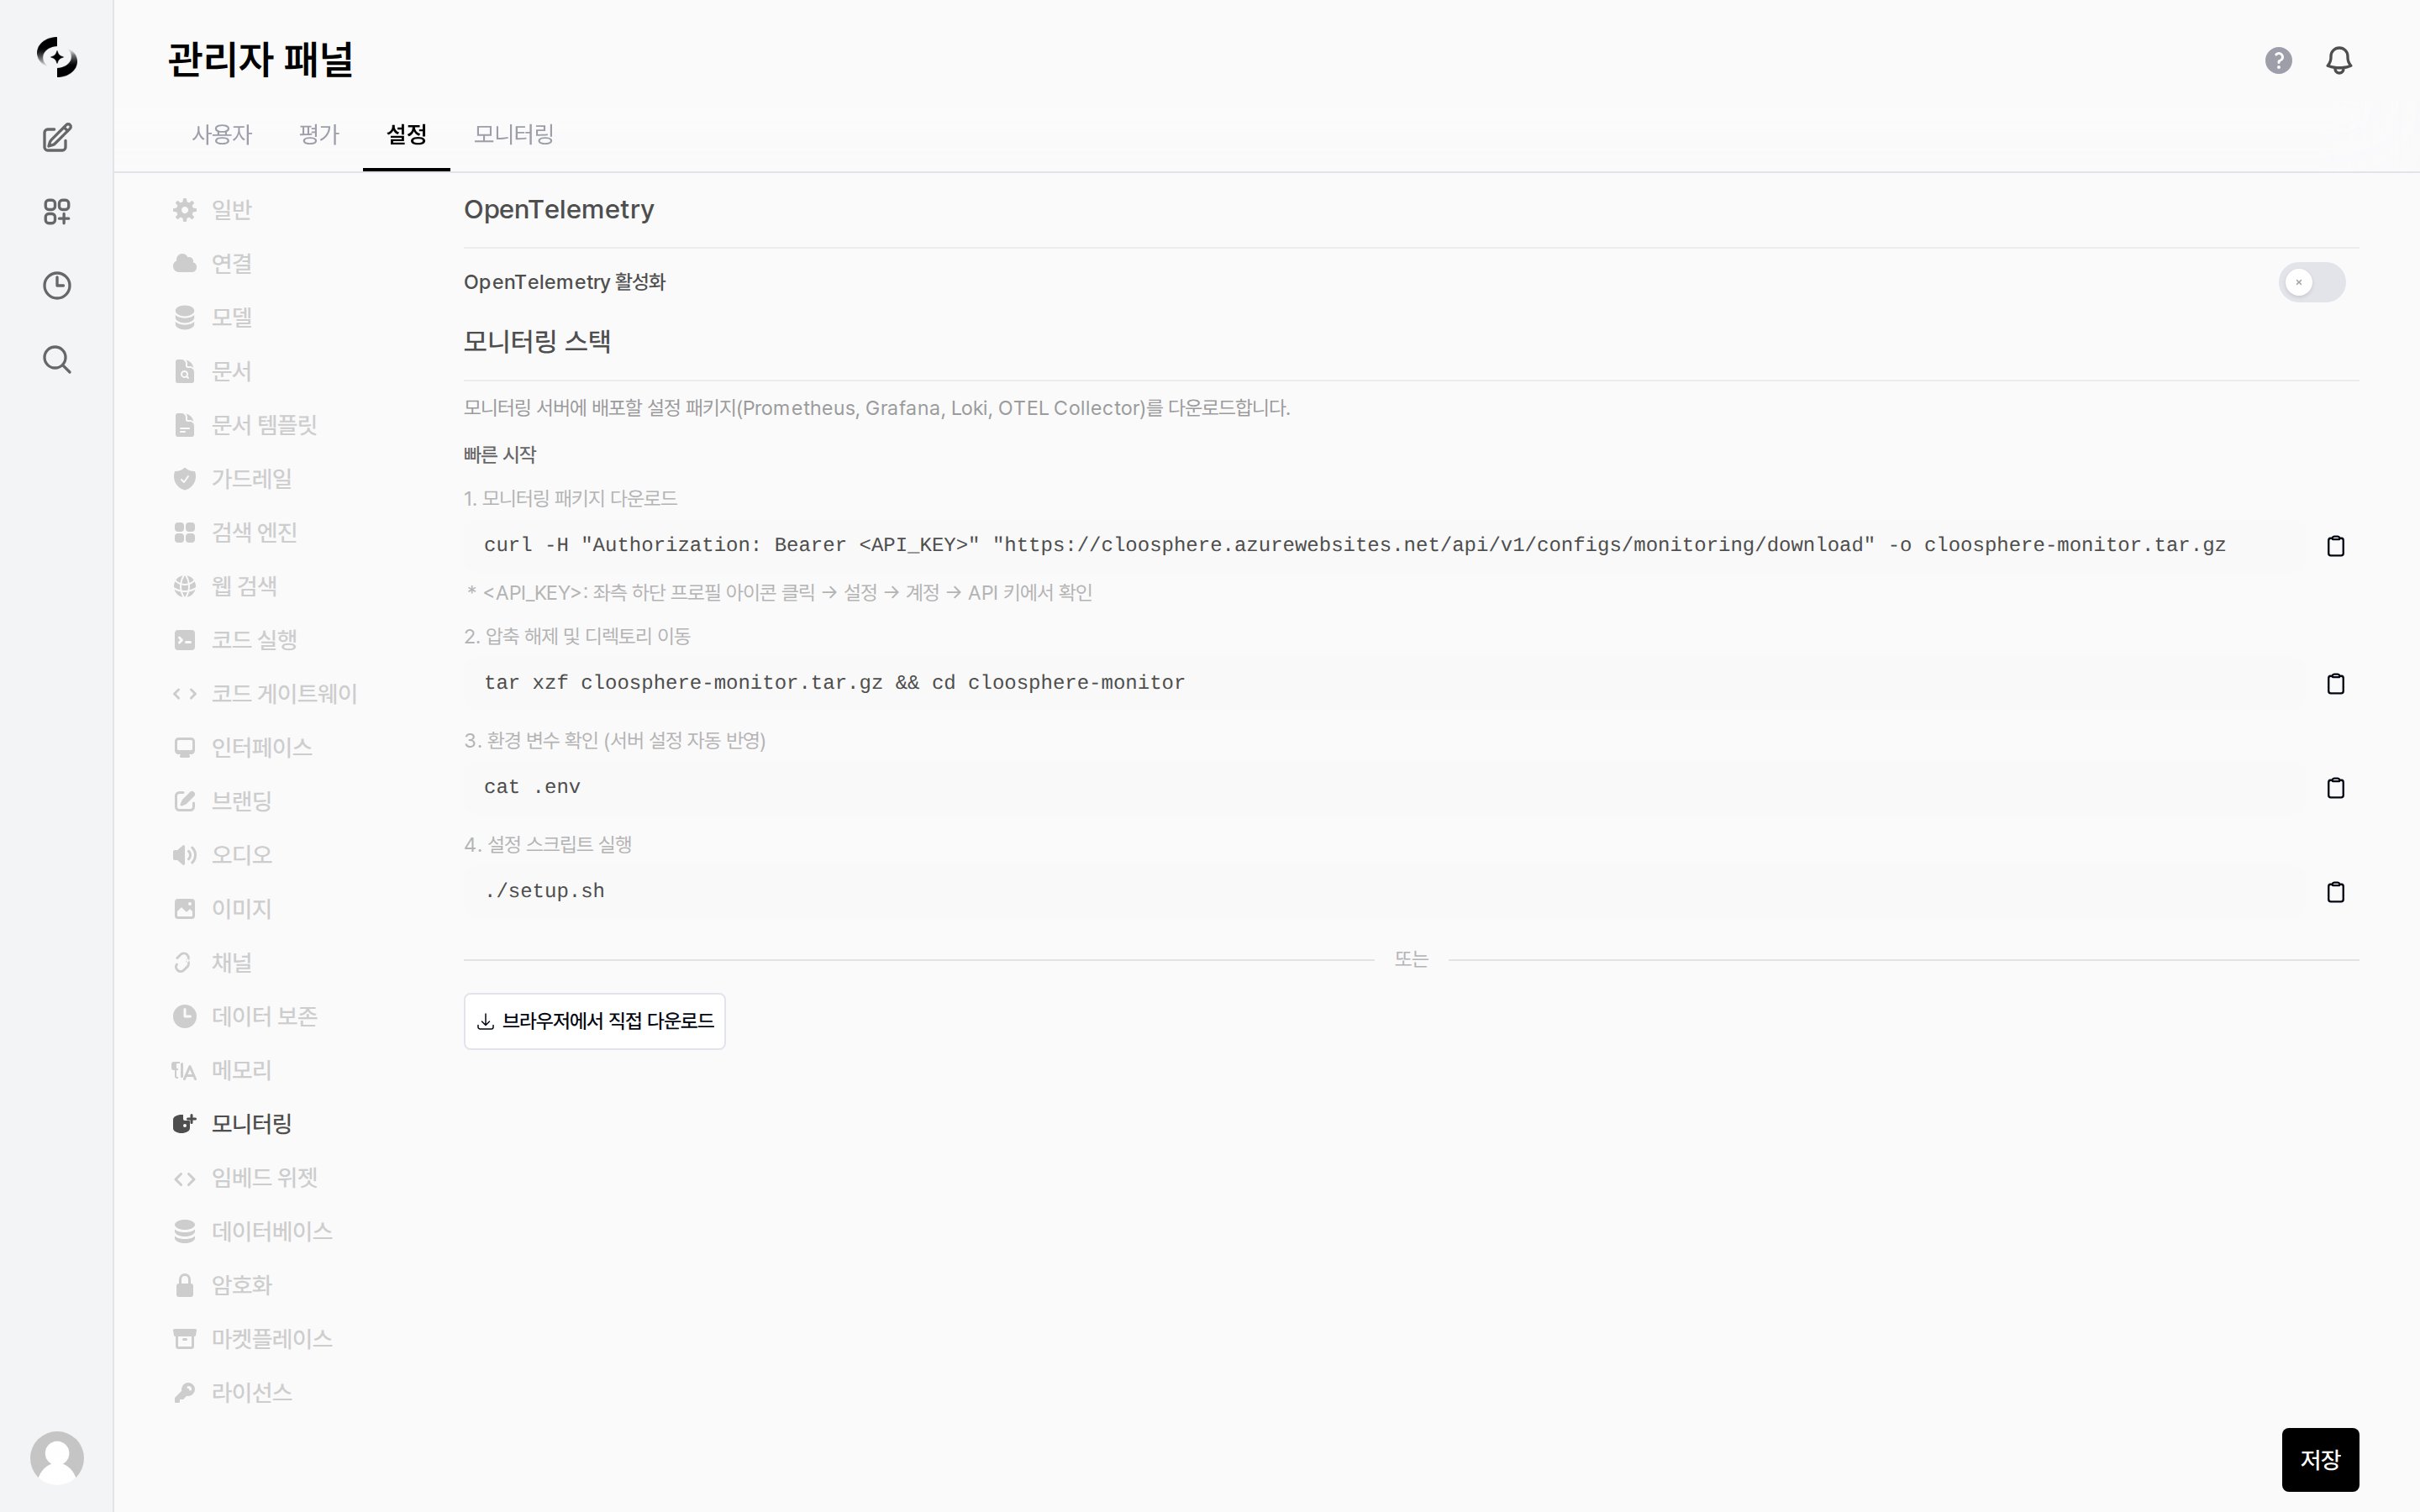
이 페이지는 **외부 관측성(observability) 스택 연동 설정**입니다. 사용량·로그를 화면에서 바로 보는 [모니터링 탭](/ko/monitoring/overview)과는 다릅니다.
OpenTelemetry(OTEL)를 활성화하면 Cloosphere의 지표·로그·트레이스를 외부 모니터링 스택으로 내보낼 수 있습니다.
* Prometheus·Grafana·Loki·OTEL Collector로 구성된 배포 패키지를 제공합니다.
 ***
## OpenTelemetry 활성화
**OpenTelemetry 활성화** 토글을 켜면 OTEL 기반 텔레메트리 수집·내보내기가 시작됩니다.
* 활성화하면 아래 항목이 표시됩니다.
| 설정 항목 | 설명 | 권장값 / 기본값 |
| ----------------- | ----------------------------------------------------------------------------------------------------------------------------- | ----------------------- |
| **OTEL Endpoint** | 텔레메트리를 내보낼 OTEL Collector 주소. 포트 `4318`(HTTP, 권장) 또는 `4317`(gRPC)을 사용하며, Azure App Service 같은 클라우드 환경에서는 HTTP(`4318`)가 필요합니다. | `http://localhost:4318` |
| **로그 내보내기 레벨** | 내보낼 로그 수준 — `DEBUG` / `INFO` / `WARNING` / `ERROR` / `CRITICAL` | `WARNING` |
이 구획의 값을 바꾸면 화면에 **"변경 사항은 애플리케이션을 재시작한 후에 적용됩니다"** 안내가 뜹니다. 저장만으로는 반영되지 않으니 서버를 재시작하세요.
***
## 모니터링 스택 배포
모니터링 서버에 배포할 설정 패키지(Prometheus·Grafana·Loki·OTEL Collector)를 내려받아 설치합니다.
```bash theme={null}
curl -H "Authorization: Bearer " \
"https:///api/v1/configs/monitoring/download" \
-o cloosphere-monitor.tar.gz
```
``는 좌측 하단 **프로필 아이콘 → 설정 → 계정 → API 키**에서 확인합니다. 화면의 **브라우저에서 직접 다운로드** 버튼을 써도 됩니다.
```bash theme={null}
tar xzf cloosphere-monitor.tar.gz && cd cloosphere-monitor
```
```bash theme={null}
cat .env
```
서버 설정이 자동으로 반영되어 있습니다.
```bash theme={null}
./setup.sh
```
외부 모니터링이 폴링할 **헬스 엔드포인트**(`/health/db`·`/health/redis`·`/health/full`)와 멀티워커 운영 점검은 [배포 체크리스트](/ko/admin/deployment-checklist)에 정리되어 있습니다.
***
## OpenTelemetry 활성화
**OpenTelemetry 활성화** 토글을 켜면 OTEL 기반 텔레메트리 수집·내보내기가 시작됩니다.
* 활성화하면 아래 항목이 표시됩니다.
| 설정 항목 | 설명 | 권장값 / 기본값 |
| ----------------- | ----------------------------------------------------------------------------------------------------------------------------- | ----------------------- |
| **OTEL Endpoint** | 텔레메트리를 내보낼 OTEL Collector 주소. 포트 `4318`(HTTP, 권장) 또는 `4317`(gRPC)을 사용하며, Azure App Service 같은 클라우드 환경에서는 HTTP(`4318`)가 필요합니다. | `http://localhost:4318` |
| **로그 내보내기 레벨** | 내보낼 로그 수준 — `DEBUG` / `INFO` / `WARNING` / `ERROR` / `CRITICAL` | `WARNING` |
이 구획의 값을 바꾸면 화면에 **"변경 사항은 애플리케이션을 재시작한 후에 적용됩니다"** 안내가 뜹니다. 저장만으로는 반영되지 않으니 서버를 재시작하세요.
***
## 모니터링 스택 배포
모니터링 서버에 배포할 설정 패키지(Prometheus·Grafana·Loki·OTEL Collector)를 내려받아 설치합니다.
```bash theme={null}
curl -H "Authorization: Bearer " \
"https:///api/v1/configs/monitoring/download" \
-o cloosphere-monitor.tar.gz
```
``는 좌측 하단 **프로필 아이콘 → 설정 → 계정 → API 키**에서 확인합니다. 화면의 **브라우저에서 직접 다운로드** 버튼을 써도 됩니다.
```bash theme={null}
tar xzf cloosphere-monitor.tar.gz && cd cloosphere-monitor
```
```bash theme={null}
cat .env
```
서버 설정이 자동으로 반영되어 있습니다.
```bash theme={null}
./setup.sh
```
외부 모니터링이 폴링할 **헬스 엔드포인트**(`/health/db`·`/health/redis`·`/health/full`)와 멀티워커 운영 점검은 [배포 체크리스트](/ko/admin/deployment-checklist)에 정리되어 있습니다.