> ## Documentation Index
> Fetch the complete documentation index at: https://docs.cloosphere.ai/llms.txt
> Use this file to discover all available pages before exploring further.
# 모니터링 개요
> 운영 가시성의 두 축 — 모니터링(시스템 사용 현황)과 평가(AI 응답 품질)로 가는 길잡이
관리자 패널 › 모니터링 · 평가
Cloosphere의 **운영 가시성**은 두 축으로 나뉩니다.
1. **모니터링** — 시스템이 어떻게 쓰이는지 (활동·사용량·로그)
2. **평가** — AI 응답이 얼마나 좋은지 (피드백·품질)
둘은 관리자 패널의 **목적이 다른 별개 메뉴**입니다. 보려는 축을 아래 탭에서 골라 들어가세요.
관리자 › 모니터링
**시스템 운영 현황**을 보는 메뉴입니다. 진입 시 **감사 로그(Audit Logs)** 탭이 기본으로 표시됩니다.
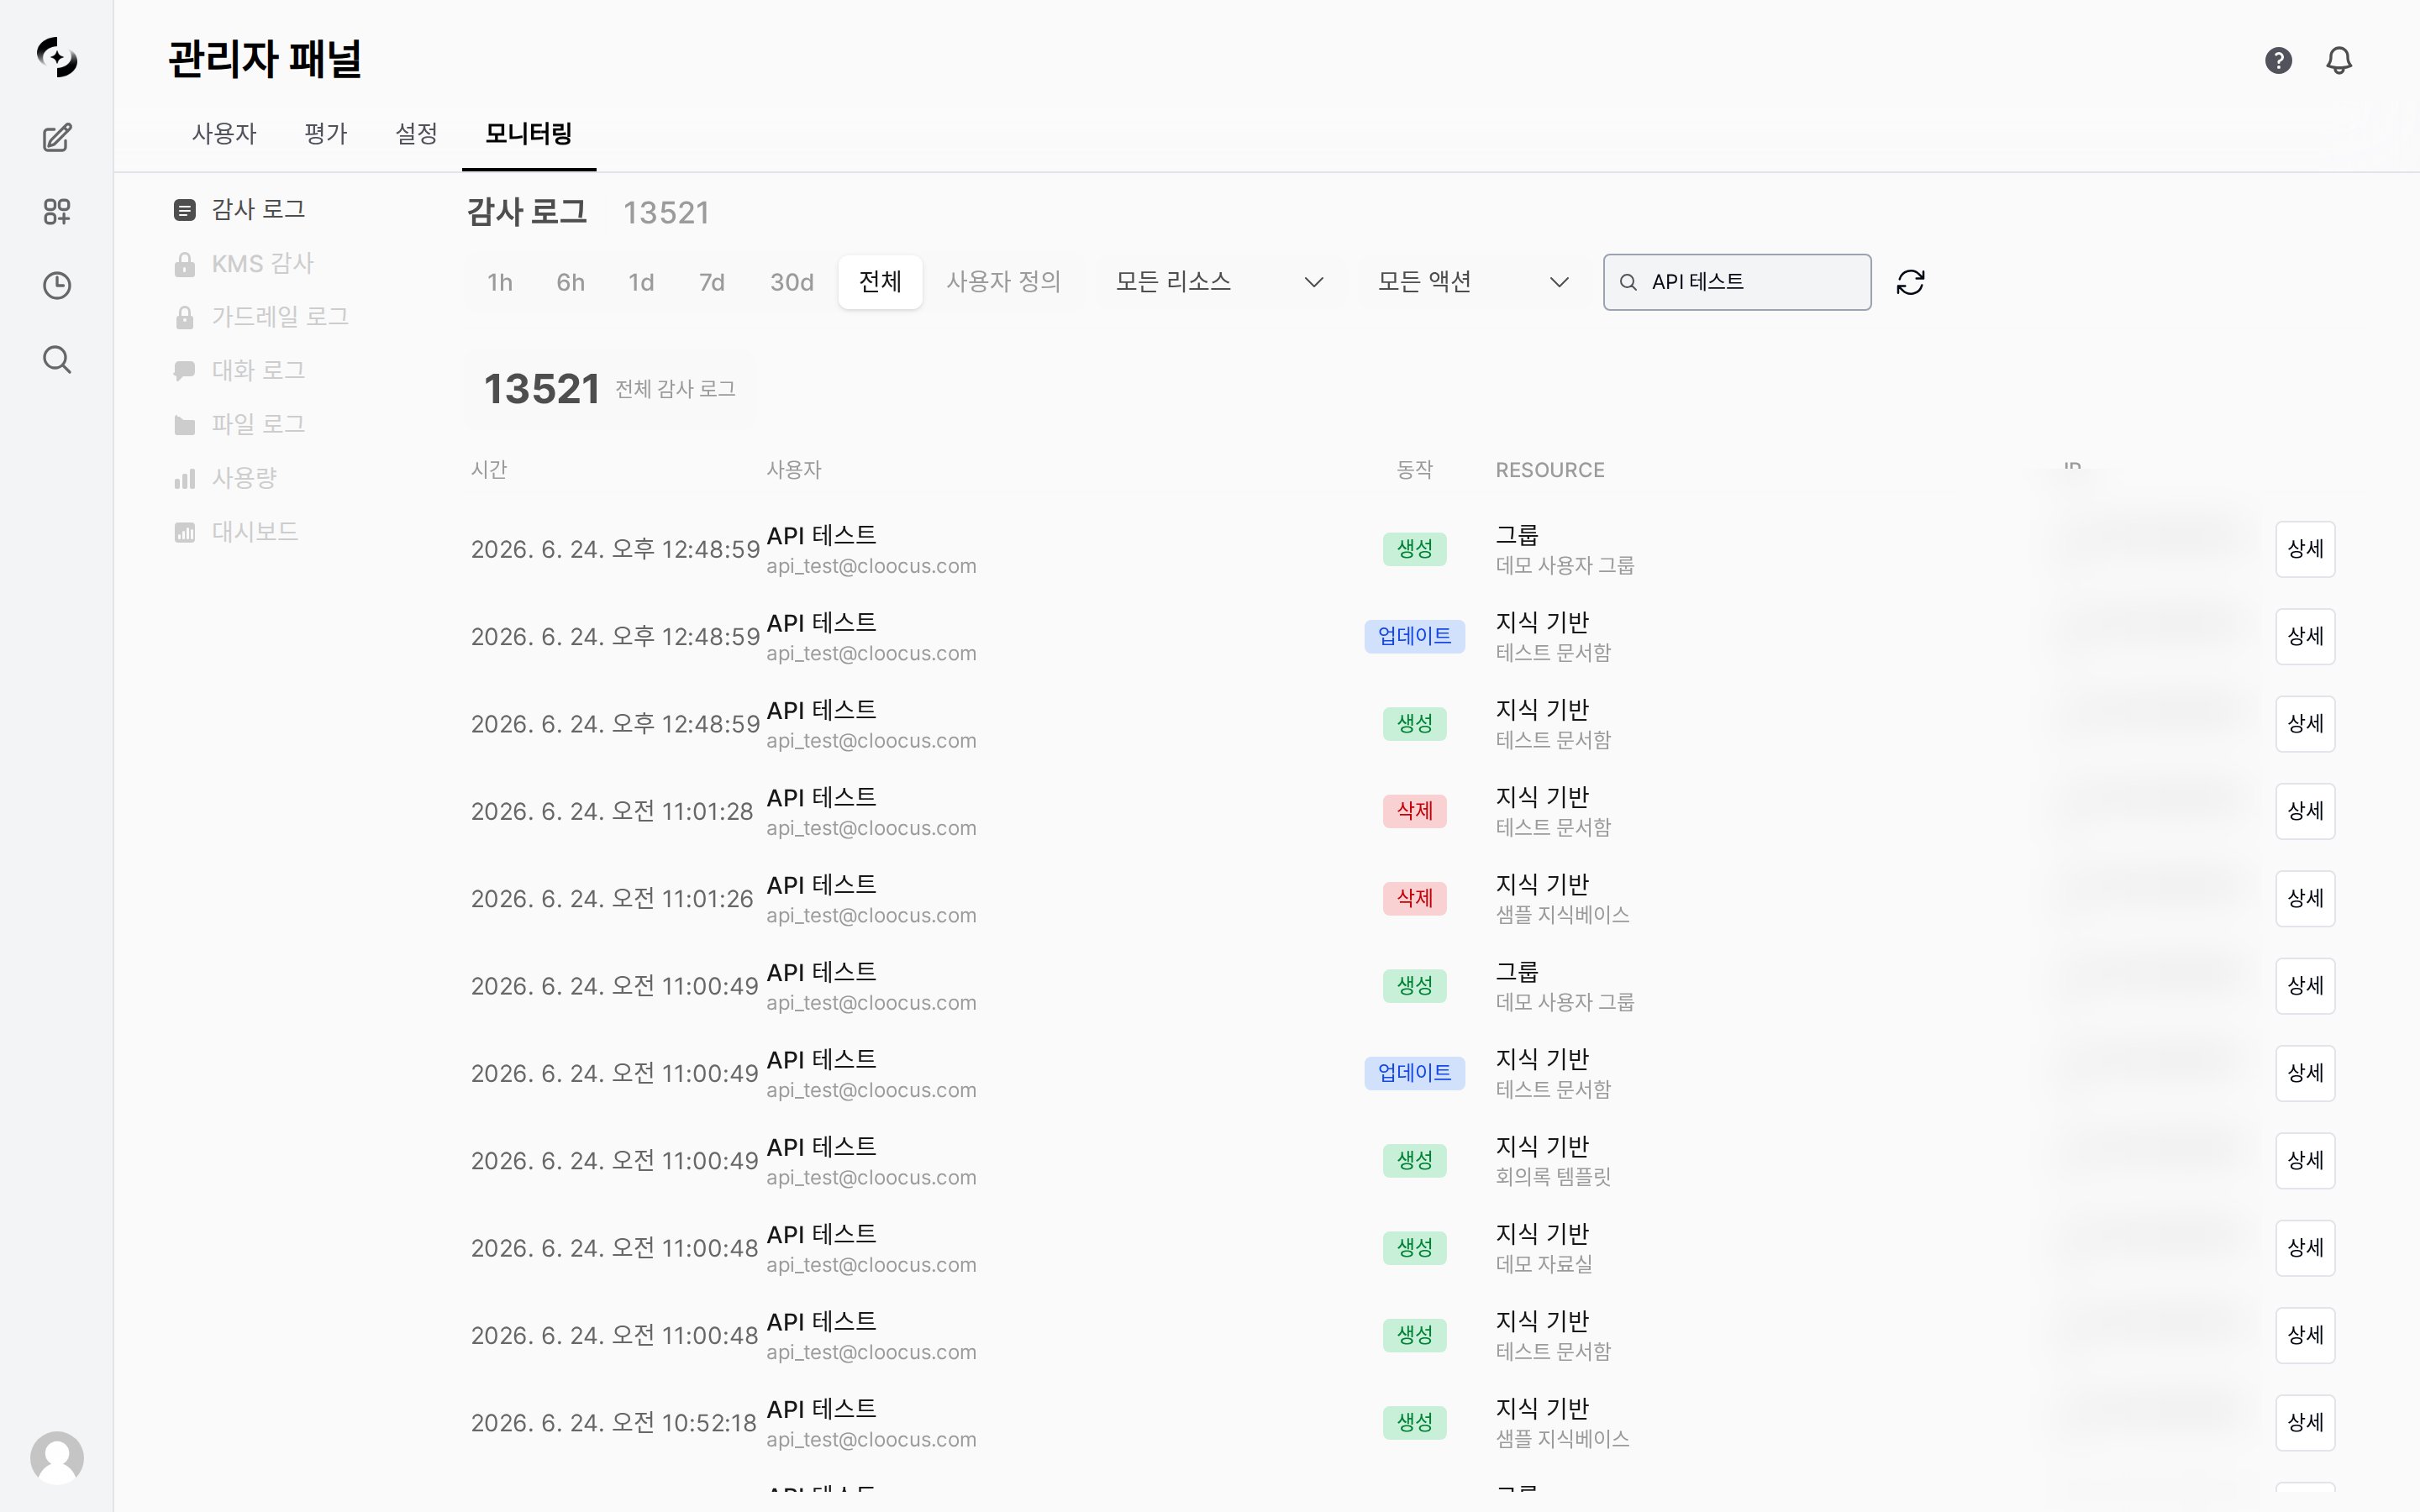 | 탭 | 기능 |
| --------------------------------------------- | ----------------------------------------- |
| [**감사 로그**](/ko/monitoring/audit-logs) | 사용자 활동 기록 조회 |
| [**KMS 감사**](/ko/monitoring/kms-audit) | 암호화 키 관리(KMS) 작업 감사 로그 |
| [**가드레일 로그**](/ko/monitoring/guardrail-logs) | 가드레일 탐지/차단 이벤트 조회 |
| [**대화 로그**](/ko/monitoring/conversation-logs) | 개별 대화(요청)별 토큰 사용 조회 |
| [**파일 로그**](/ko/monitoring/file-logs) | 파일 업로드 보안 모니터링 (가드레일 분류 결과, 차단/플래그 파일 추적) |
| [**사용량**](/ko/monitoring/usage) | 토큰 사용량, 비용, 통계 대시보드 |
| [**대시보드**](/ko/monitoring/dashboard) | AI 기반 패널 차트, 공유, HTML 내보내기 |
**대화 로그** 탭은 개별 대화(요청)를 행 단위로 조회합니다. 자세한 내용은 [대화 로그](/ko/monitoring/conversation-logs)를 참고하세요.
**파일 로그** 탭은 환경 설정에 따라 조건부로 표시되며, 설정에 따라 메뉴에 보이지 않을 수 있습니다.
관리자 › 평가
**AI 응답 품질**을 보는 메뉴입니다.
| 탭 | 기능 |
| --------------------------------------------- | ----------------------------------------- |
| [**감사 로그**](/ko/monitoring/audit-logs) | 사용자 활동 기록 조회 |
| [**KMS 감사**](/ko/monitoring/kms-audit) | 암호화 키 관리(KMS) 작업 감사 로그 |
| [**가드레일 로그**](/ko/monitoring/guardrail-logs) | 가드레일 탐지/차단 이벤트 조회 |
| [**대화 로그**](/ko/monitoring/conversation-logs) | 개별 대화(요청)별 토큰 사용 조회 |
| [**파일 로그**](/ko/monitoring/file-logs) | 파일 업로드 보안 모니터링 (가드레일 분류 결과, 차단/플래그 파일 추적) |
| [**사용량**](/ko/monitoring/usage) | 토큰 사용량, 비용, 통계 대시보드 |
| [**대시보드**](/ko/monitoring/dashboard) | AI 기반 패널 차트, 공유, HTML 내보내기 |
**대화 로그** 탭은 개별 대화(요청)를 행 단위로 조회합니다. 자세한 내용은 [대화 로그](/ko/monitoring/conversation-logs)를 참고하세요.
**파일 로그** 탭은 환경 설정에 따라 조건부로 표시되며, 설정에 따라 메뉴에 보이지 않을 수 있습니다.
관리자 › 평가
**AI 응답 품질**을 보는 메뉴입니다.
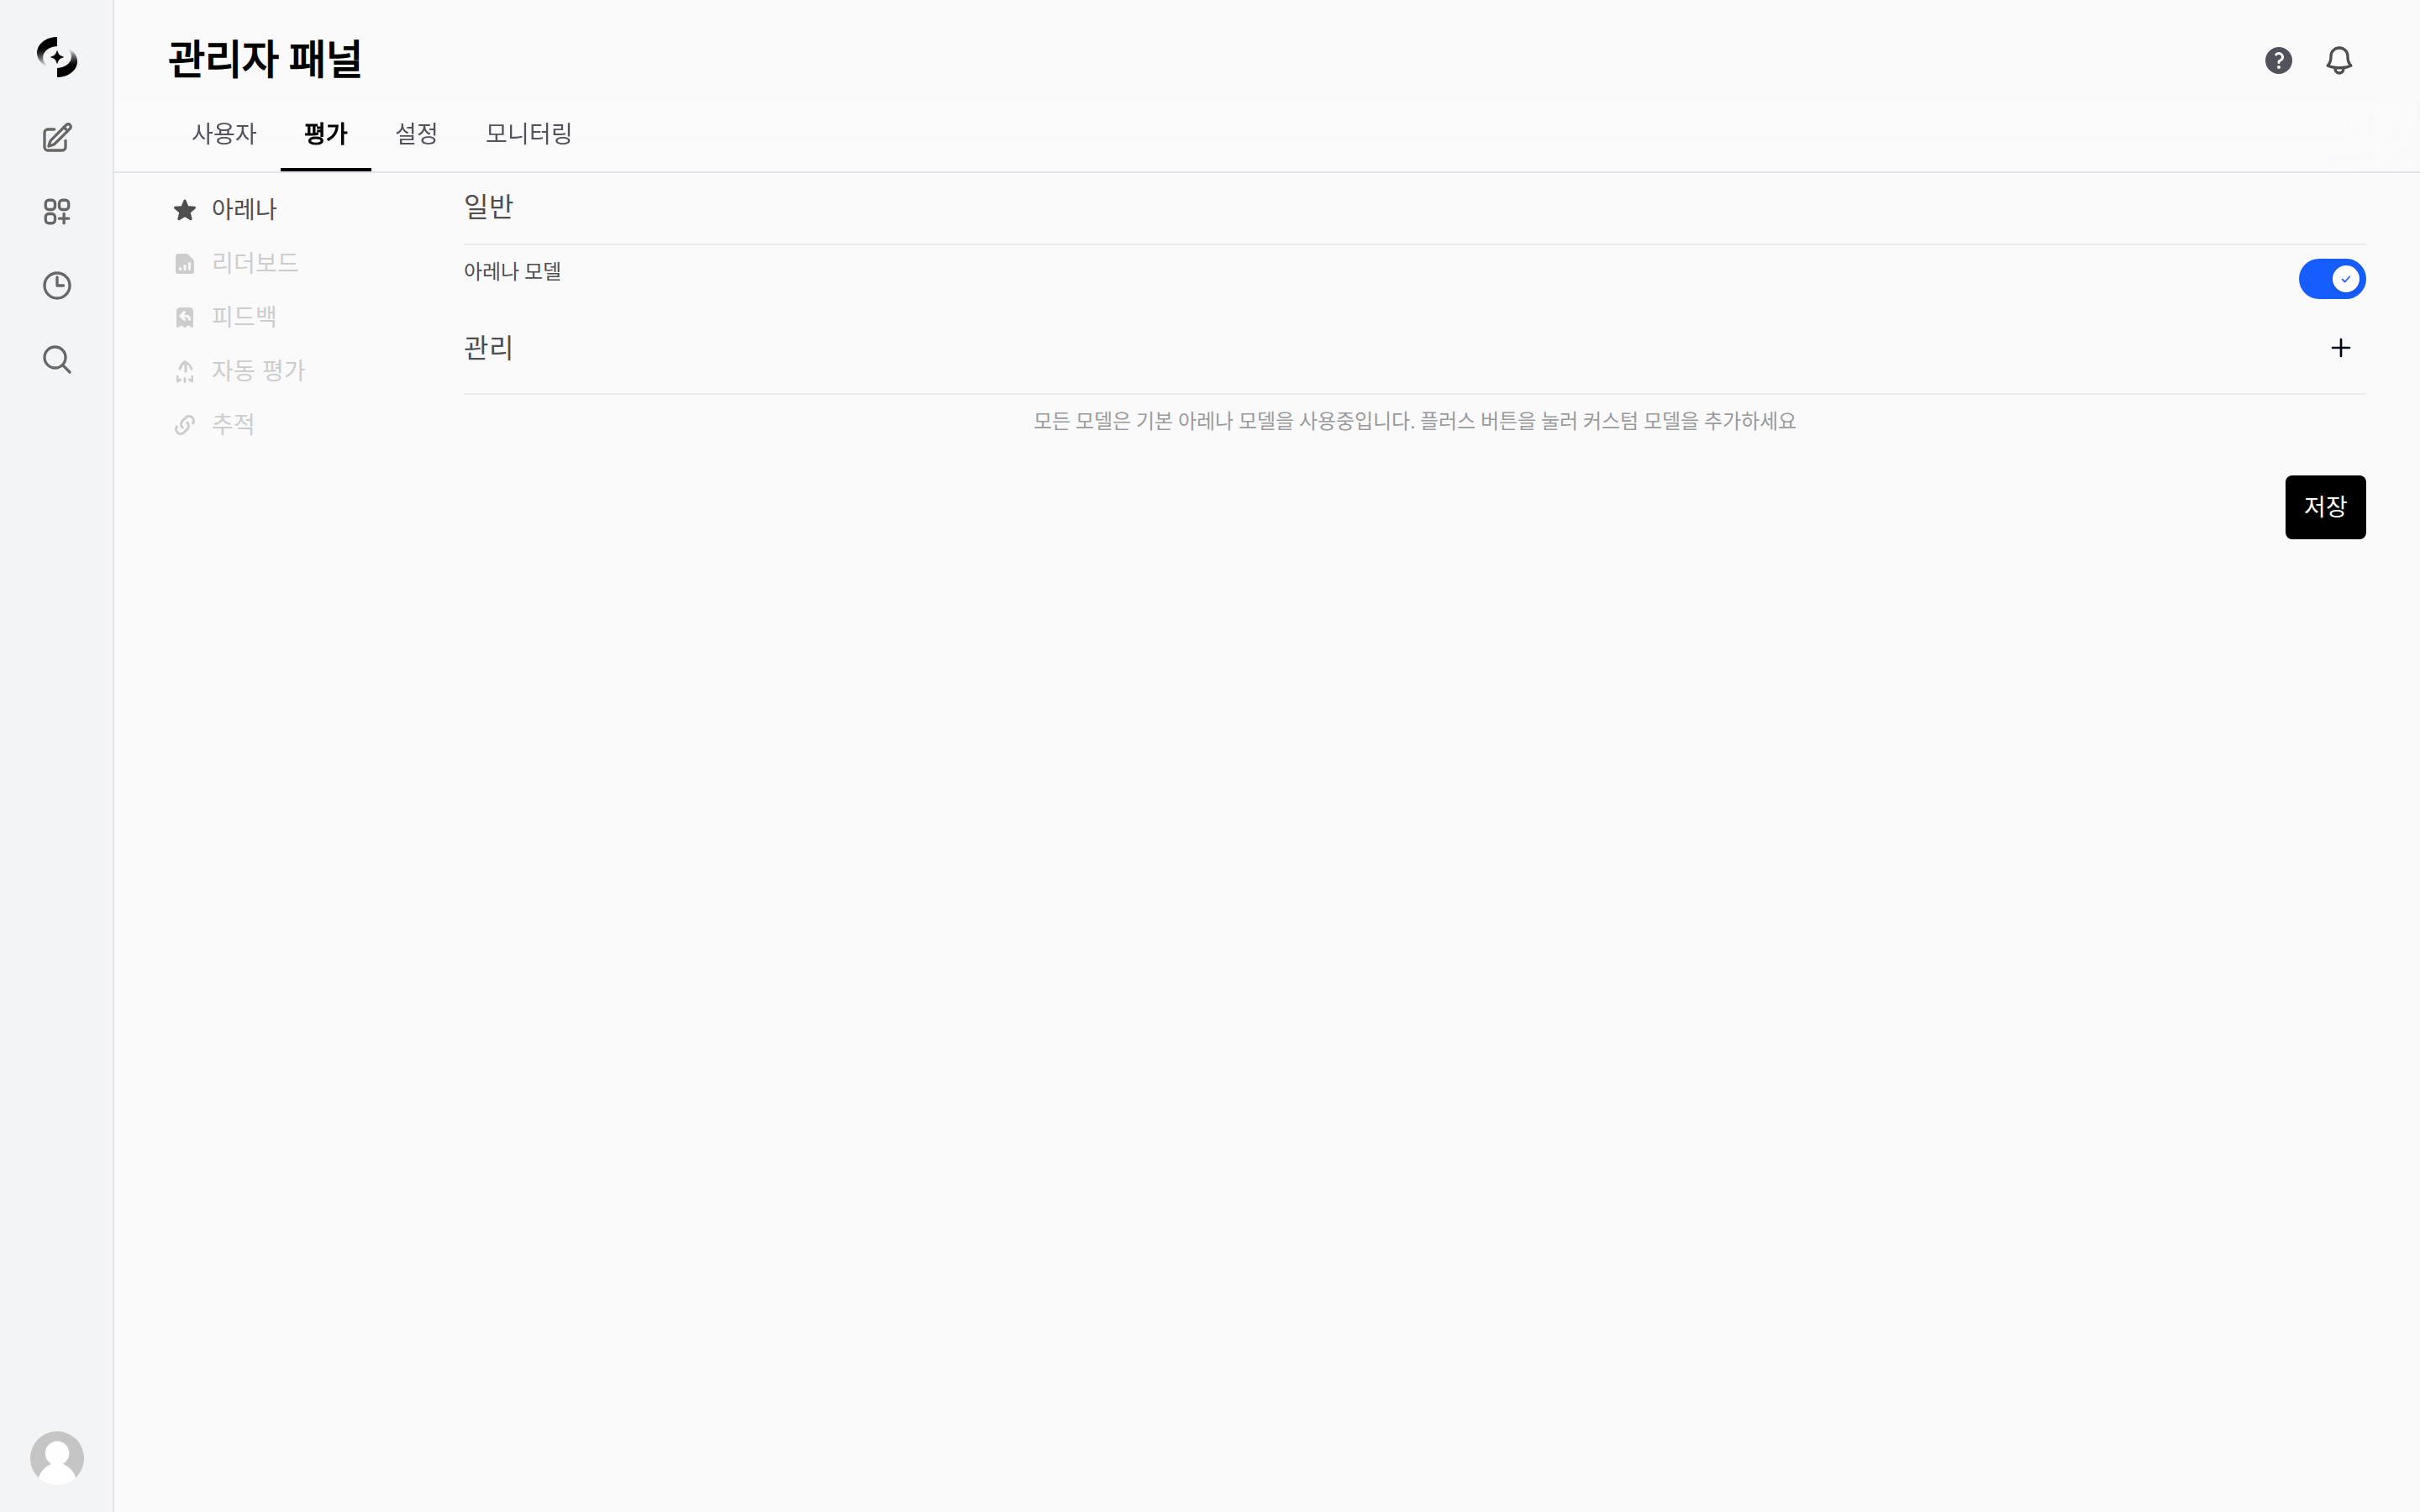 | 탭 | 기능 |
| ------------------------------------------------------------- | ------------------------------ |
| [**아레나**](/ko/monitoring/arena-leaderboard#아레나-arena) | 두 모델 응답을 익명으로 나란히 비교·평가 (기본 탭) |
| [**리더보드**](/ko/monitoring/arena-leaderboard#리더보드-leaderboard) | 아레나 결과 기반 Elo 모델 순위 |
| [**피드백**](/ko/monitoring/feedback) | 사용자 응답 평가(승리/패배) 기록 조회 |
| [**자동 평가**](/ko/monitoring/auto-evaluations) | LLM 기반 응답 품질 자동 측정 결과 |
| [**추적**](/ko/monitoring/tracing) | LLM 요청 처리 과정 추적 |
평가는 전용 개요가 있습니다 — 측정·진단 흐름과 각 탭 안내는 [평가 개요](/ko/monitoring/evaluations)를 참고하세요.
***
## 활용 시나리오
| 시나리오 | 방법 |
| --------------- | ------------------------------------------------- |
| **월별 AI 비용 분석** | 사용량 대시보드에서 조직/모델별 토큰 소비를 확인하고 CSV로 내보내 비용 보고서를 작성 |
| **보안 사고 조사** | 감사 로그에서 의심스러운 활동을 기간/사용자별로 필터링해 사고 경위를 추적 |
| **응답 품질 디버깅** | 추적에서 특정 메시지의 처리 과정을 단계별로 확인하고 LLM 분석 리포트를 생성 |
| **가드레일 정책 개선** | 가드레일 로그에서 탐지 패턴을 분석해 오탐률을 줄이고 보안 정책을 강화 |
***
## 정기 점검 권장 주기
| 주기 | 점검 항목 |
| ------ | ------------------------------- |
| **일간** | 이상 사용 패턴, 가드레일 차단 이벤트 확인 |
| **주간** | 사용량 추이, 자동 평가 점수 트렌드 검토 |
| **월간** | 비용 분석 보고서, 감사 로그 요약, 가드레일 정책 리뷰 |
| **분기** | 전체 활용도 평가, 모델 비용 효율성 분석 |
| 탭 | 기능 |
| ------------------------------------------------------------- | ------------------------------ |
| [**아레나**](/ko/monitoring/arena-leaderboard#아레나-arena) | 두 모델 응답을 익명으로 나란히 비교·평가 (기본 탭) |
| [**리더보드**](/ko/monitoring/arena-leaderboard#리더보드-leaderboard) | 아레나 결과 기반 Elo 모델 순위 |
| [**피드백**](/ko/monitoring/feedback) | 사용자 응답 평가(승리/패배) 기록 조회 |
| [**자동 평가**](/ko/monitoring/auto-evaluations) | LLM 기반 응답 품질 자동 측정 결과 |
| [**추적**](/ko/monitoring/tracing) | LLM 요청 처리 과정 추적 |
평가는 전용 개요가 있습니다 — 측정·진단 흐름과 각 탭 안내는 [평가 개요](/ko/monitoring/evaluations)를 참고하세요.
***
## 활용 시나리오
| 시나리오 | 방법 |
| --------------- | ------------------------------------------------- |
| **월별 AI 비용 분석** | 사용량 대시보드에서 조직/모델별 토큰 소비를 확인하고 CSV로 내보내 비용 보고서를 작성 |
| **보안 사고 조사** | 감사 로그에서 의심스러운 활동을 기간/사용자별로 필터링해 사고 경위를 추적 |
| **응답 품질 디버깅** | 추적에서 특정 메시지의 처리 과정을 단계별로 확인하고 LLM 분석 리포트를 생성 |
| **가드레일 정책 개선** | 가드레일 로그에서 탐지 패턴을 분석해 오탐률을 줄이고 보안 정책을 강화 |
***
## 정기 점검 권장 주기
| 주기 | 점검 항목 |
| ------ | ------------------------------- |
| **일간** | 이상 사용 패턴, 가드레일 차단 이벤트 확인 |
| **주간** | 사용량 추이, 자동 평가 점수 트렌드 검토 |
| **월간** | 비용 분석 보고서, 감사 로그 요약, 가드레일 정책 리뷰 |
| **분기** | 전체 활용도 평가, 모델 비용 효율성 분석 |