Monitoring Targets
| Area | Purpose | Target Users |
|---|---|---|
| BI Dashboard | Visualize operational data, AI auto-chart generation, sharing | Admin, Executives |
| Usage | Token consumption, cost, usage pattern analysis | Admin, Team Lead |
| Audit Log | User activity records, compliance | Admin, Security |
| Guardrail Logs | Track sensitive info detection/blocking events | Admin, Security |
| Tracing | Step-by-step LLM request processing tracking | Admin, Developer |
| Evaluation | Response quality measurement (manual feedback + auto-evaluation + Leaderboard) | Admin, Quality Manager |
How to Access
Monitoring features are accessed in two places.- Admin > Monitoring
- Admin > Evaluations
Access via Admin > Monitoring in the sidebar. The Audit Logs tab is the default landing.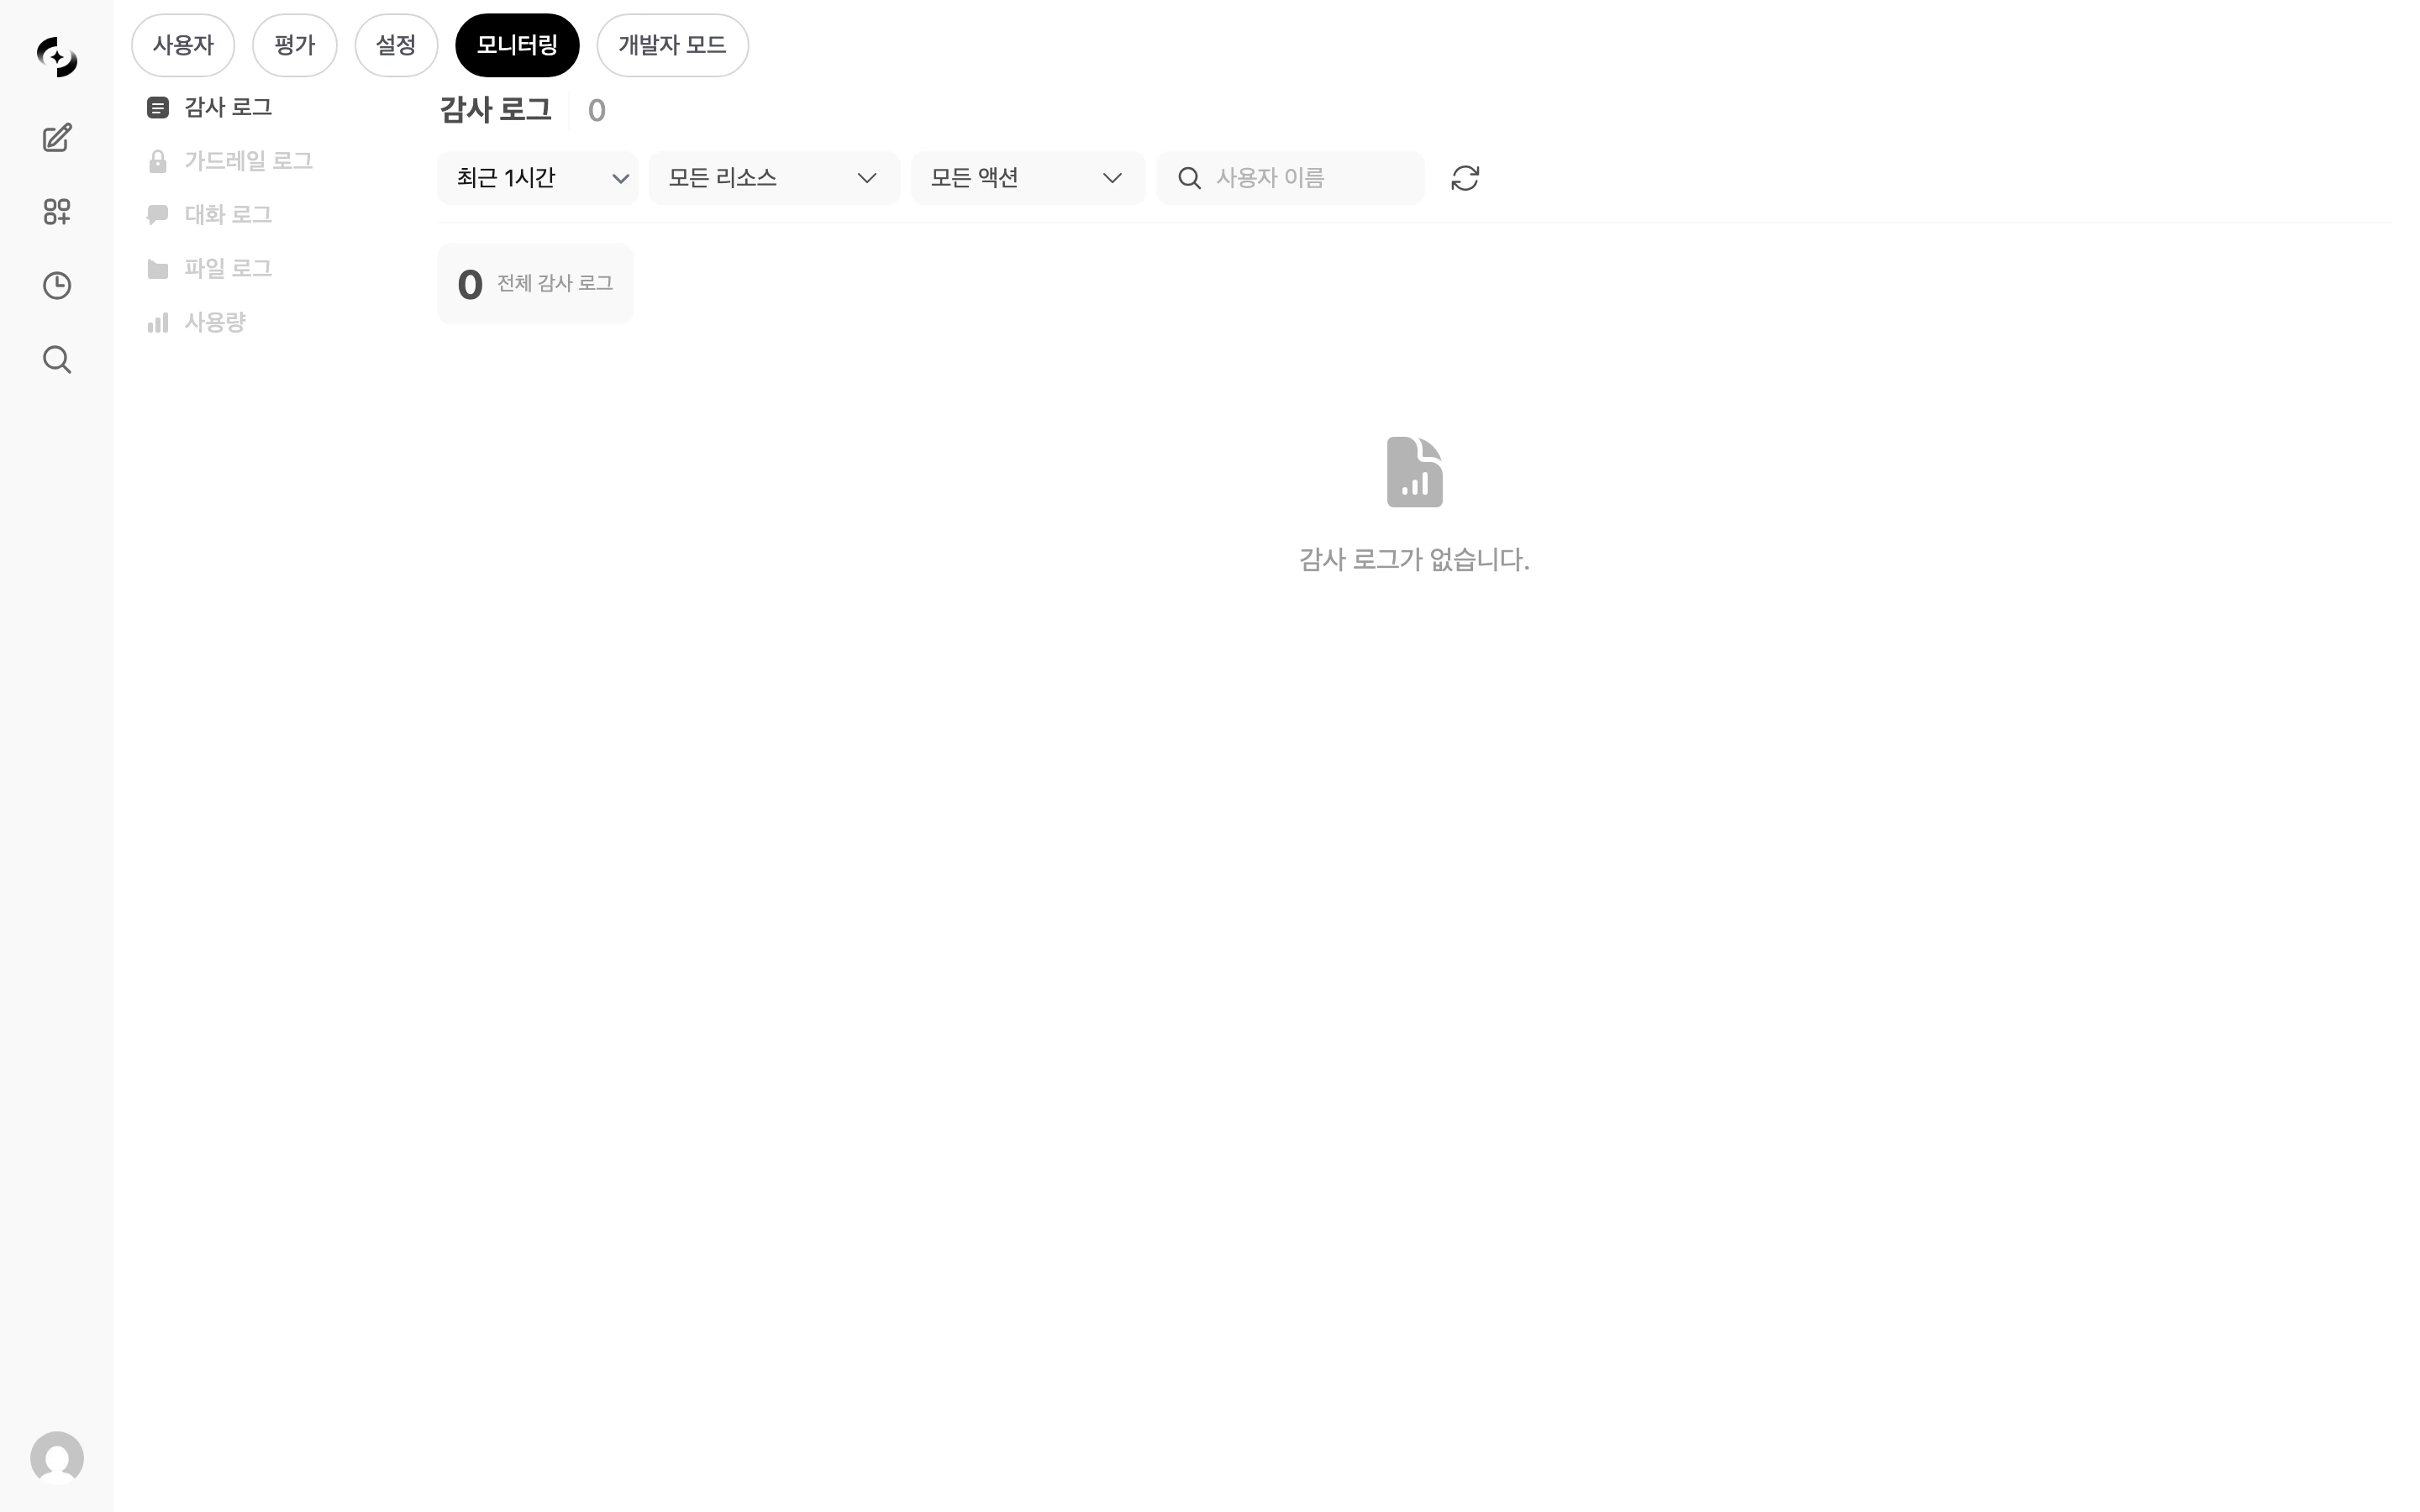
| Tab | Function |
|---|---|
| Dashboard | BI Dashboard — AI-based panel charts, sharing, HTML export |
| Audit Logs | View user activity records |
| Guardrail Logs | View guardrail detection/blocking events |
| Conversation Logs | View conversation records |
| File Logs | File upload security monitoring (guardrail classification, blocked/flagged file tracking) |
| Usage | Token usage, cost, statistics dashboard |
The Conversation Logs tab views conversation records. A separate guide page is coming later.
The File Logs tab is shown conditionally by feature flag. May not appear in the menu depending on environment settings.

Use Cases
Monthly AI Cost Analysis
Check token consumption by organization/model in the usage dashboard, export to CSV for cost reports.
Security Incident Investigation
Filter suspicious activity in audit logs by time range/user to trace incident details.
Response Quality Debugging
In tracing, review step-by-step processing for specific messages and generate LLM analysis reports.
Guardrail Policy Improvement
Analyze detection patterns in guardrail logs to reduce false positives and strengthen security policy.
Recommended Review Cadence
| Cadence | Items |
|---|---|
| Daily | Anomalous usage patterns, guardrail blocking events |
| Weekly | Usage trends, auto-evaluation score trend review |
| Monthly | Cost analysis report, audit log summary, guardrail policy review |
| Quarterly | Overall utilization assessment, model cost-effectiveness analysis |
Detailed Features
BI Dashboard
AI-based panel dashboard — auto-generate SQL charts from natural language and share
Usage
Token usage, cost, per-model/user/organization analysis
Audit Log
User activity records and compliance audit
Guardrail Logs
Sensitive info detection/blocking event log
Tracing
Step-by-step LLM request processing tracking
Evaluation
Manual feedback and automatic quality evaluation