Admin › Monitoring › Usage
- Analyze token usage and request count across multiple dimensions (model, user, agent, group, team).
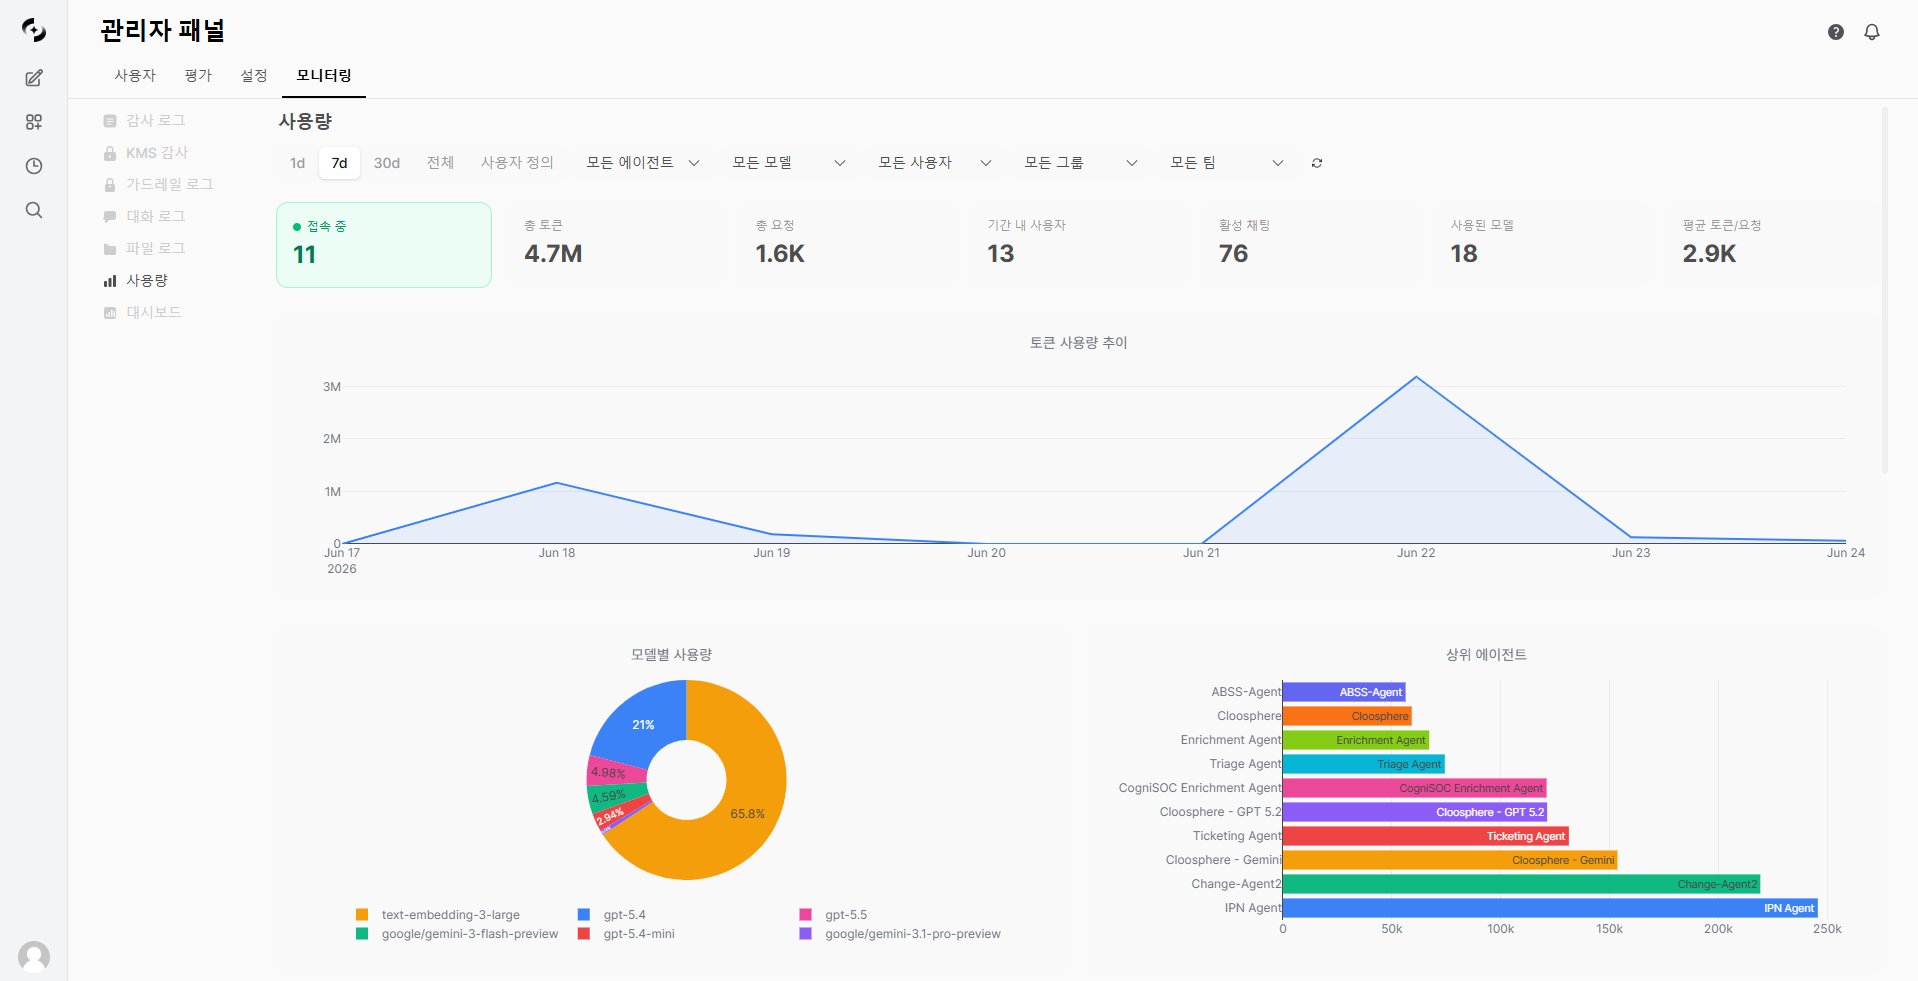
See token, request, and user status at a glance under Admin > Monitoring > Usage
Key Metrics
Key metrics appear at the top of the dashboard as cards.Usage Trend Chart
Visualize usage over time as a line chart.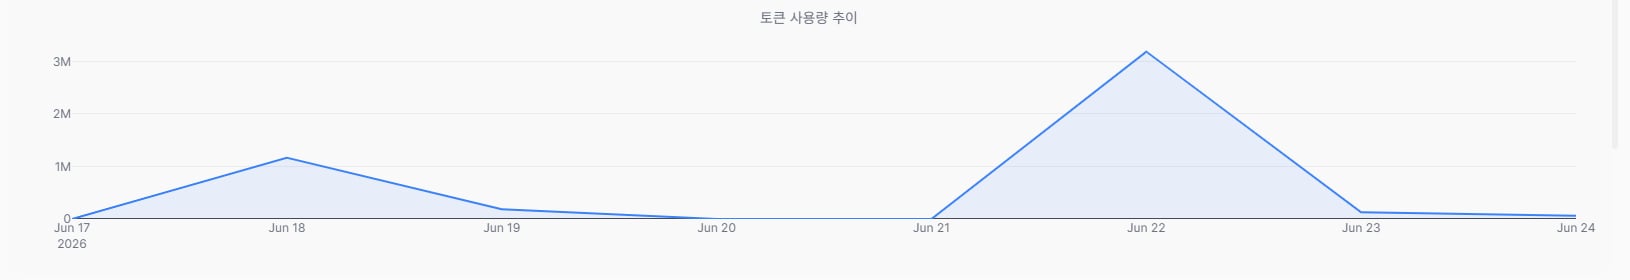
Usage trend chart — daily token line graph
Period Selection
Chart Metric
The chart shows token usage trend as a line graph.Multi-dimensional Analysis
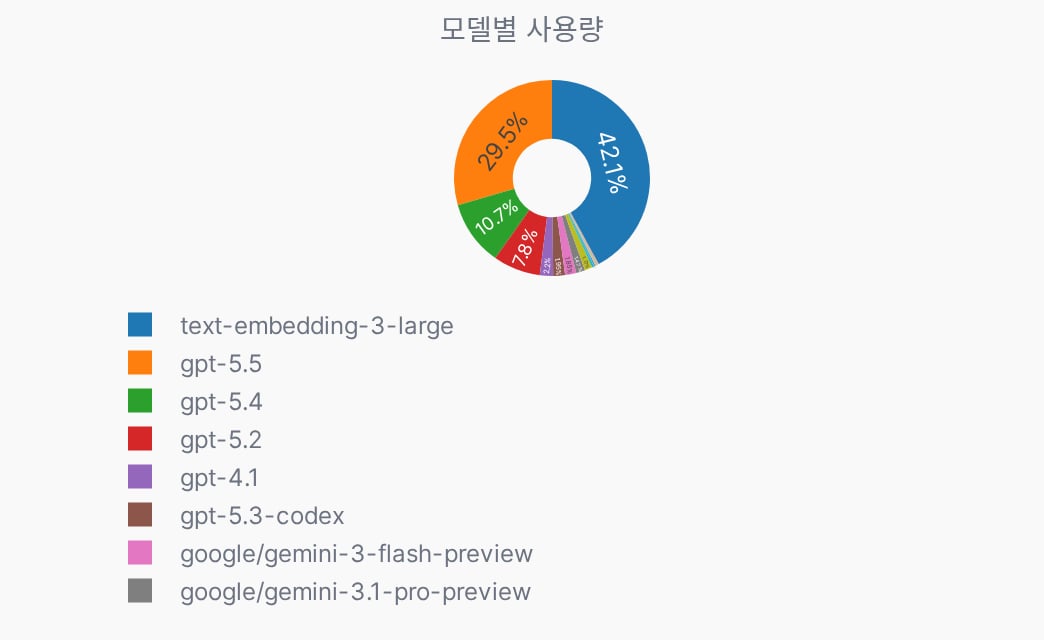
Break usage down by model, user, agent, group, and team.- All charts respond to the top filters (period, model, user, group, team, agent).
- By Model
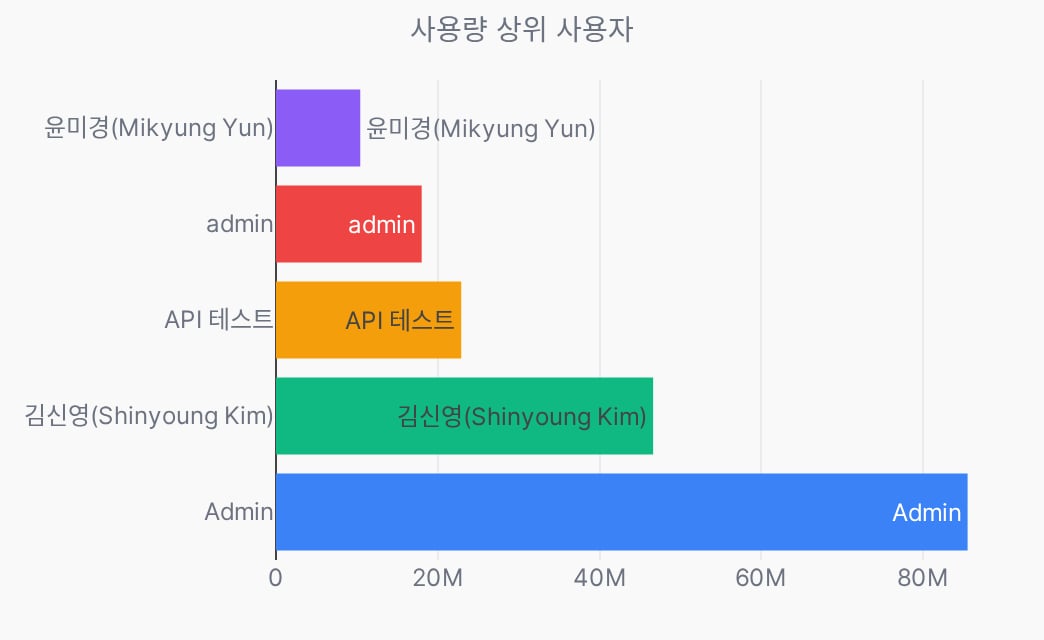
- By User
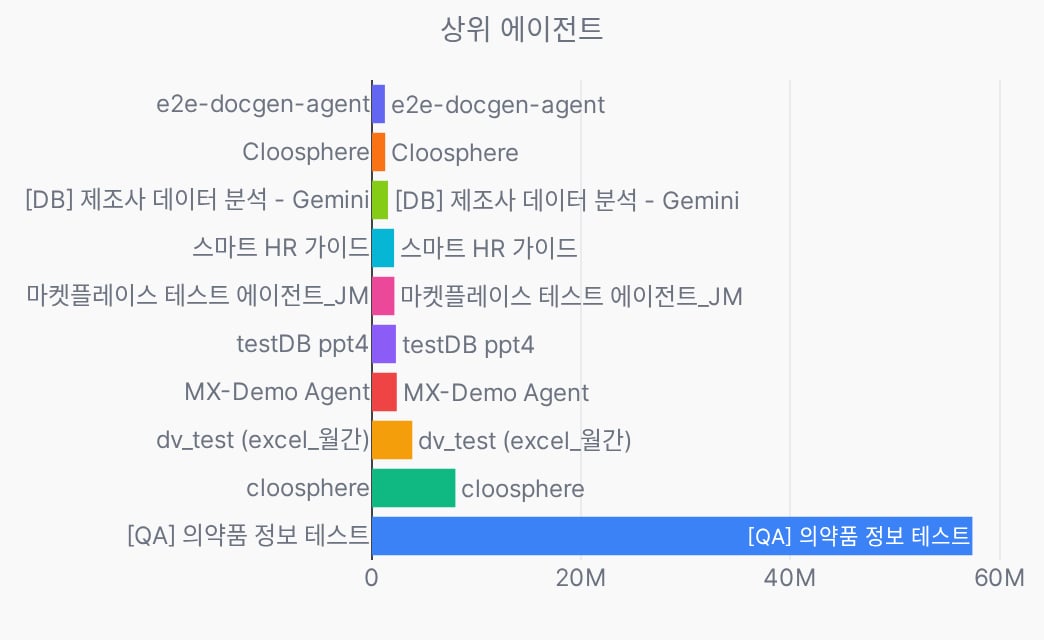
- By Agent
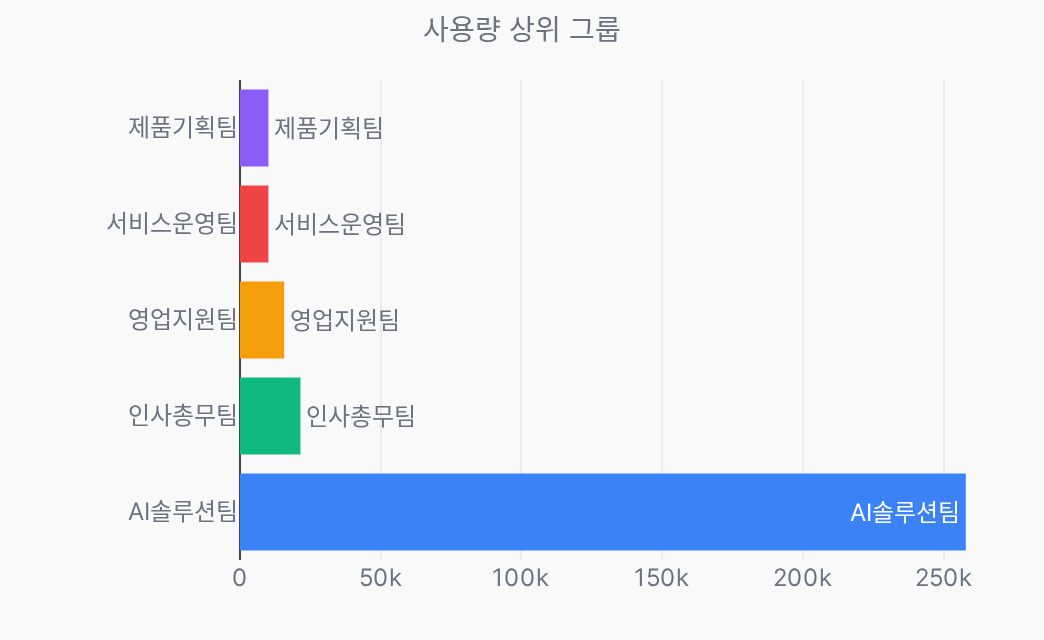
- By Group
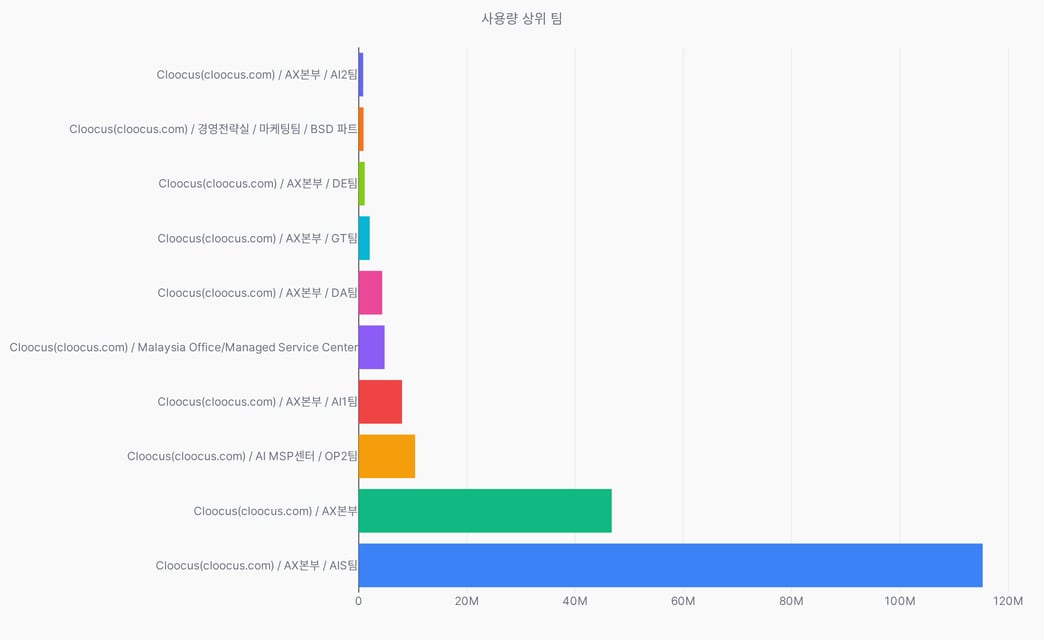
- By Team
Usage Type Classification
Classify what work tokens were used for.- The chart shows only types with usage records in the selected period.
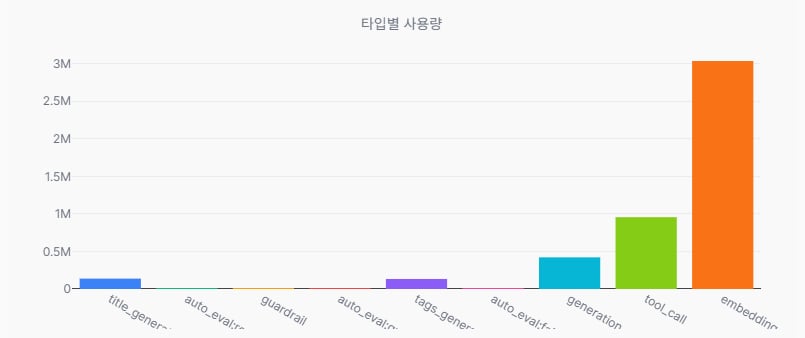
Distribution by usage type
Usage types
Usage types
Only types with actual activity in the period appear in the chart.User activity (counts toward the daily limit)
Background tasks (not counted toward the limit)
System / monitoring
Filtering
Combine multiple conditions to filter data.- All filters apply simultaneously.
Filter dropdowns only show items with actual usage records.
Individual conversation details are available in a separate Monitoring > Conversation Logs tab.
Related Pages
General
Configure usage limits and excess actions
Tracing
Track per-request token usage
Auto-Evaluations
Review response quality evaluation results