Admin › Monitoring › Conversation Logs
Conversation Logs include actual user names and emails. Only admins with access permission can view them.
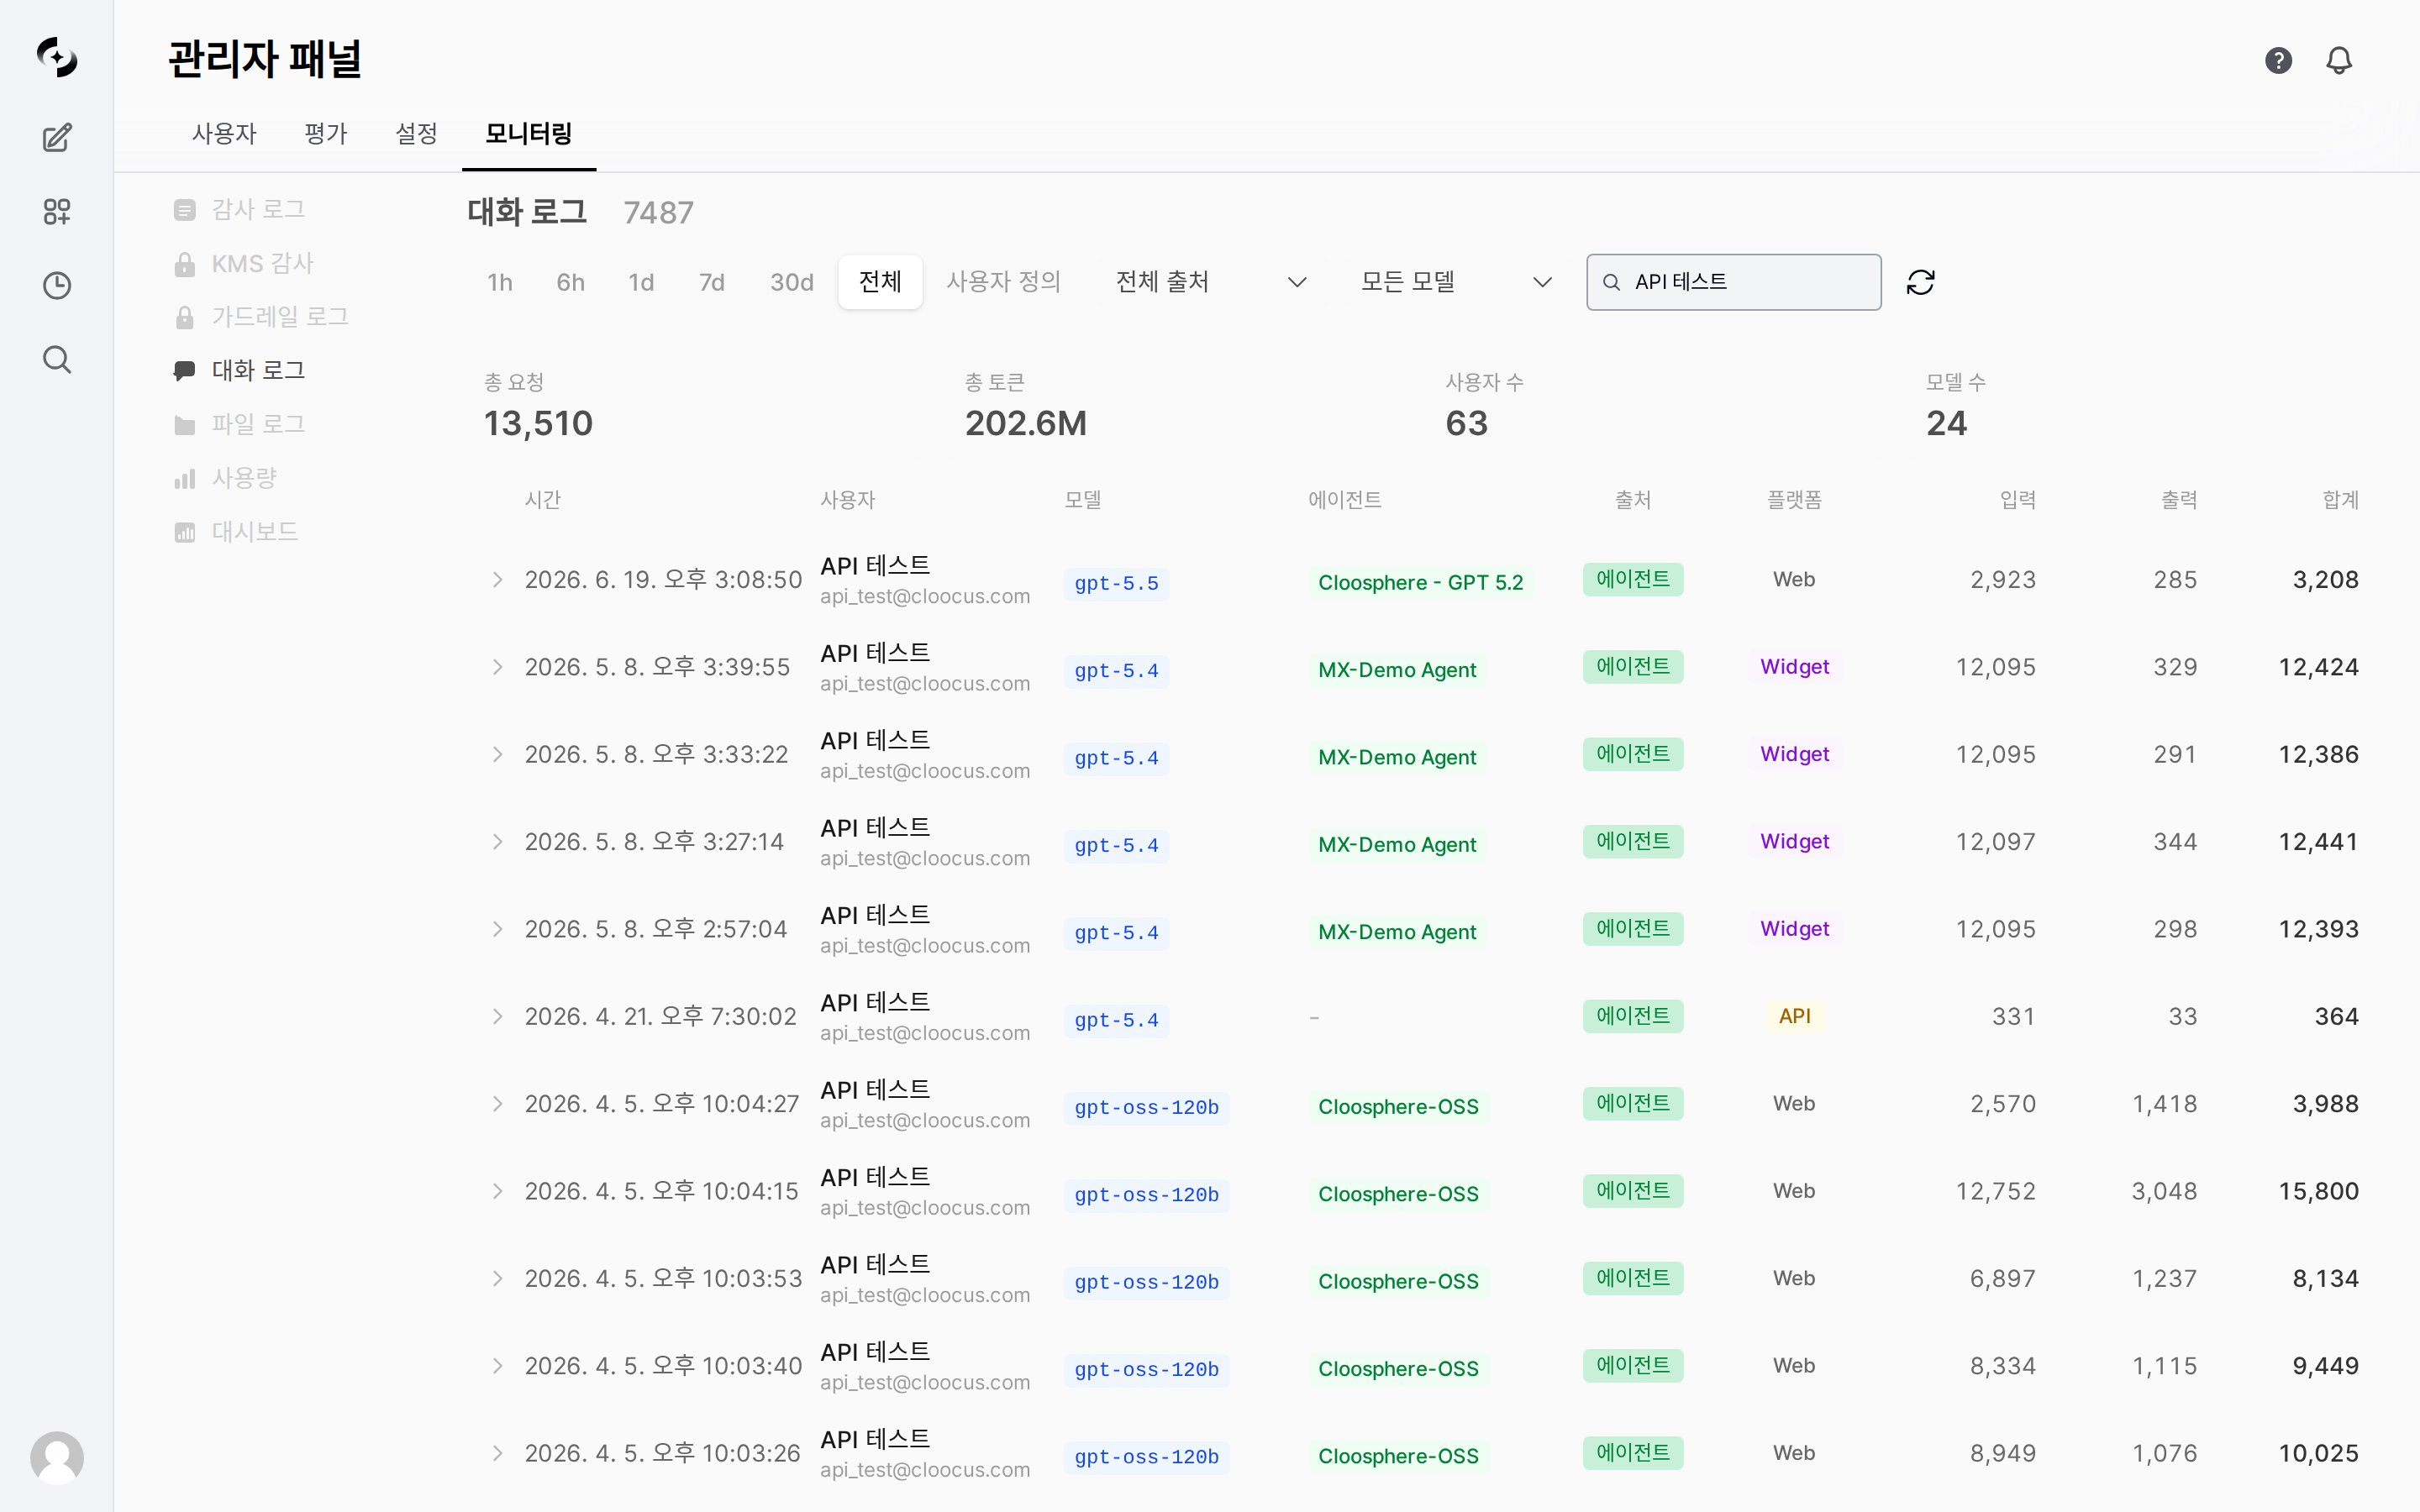
Statistics Summary
The top of the screen shows aggregate cards based on the current period and filters.| Metric | Meaning |
|---|---|
| Total requests | Number of requests matching the conditions |
| Total tokens | Sum of input + output tokens |
| User count | Number of distinct users who made requests |
| Model count | Number of distinct models used |
Log Entry Structure
Each row is a single request. The table consists of the following columns.All columns (9)
All columns (9)
| Column | Description |
|---|---|
| Time | When the request occurred |
| User | Requesting user (name, email) |
| Model | Model used for the response (e.g., google/gemini-3-flash-preview) |
| Agent | Agent the request went through (when applicable) |
| Source | Request source type — general chat (Chat), agent (Agent), code gateway (Code), API |
| Platform | Client the request came from (e.g., Web) |
| Input | Input (prompt) tokens |
| Output | Output (response) tokens |
| Total | Sum of input + output tokens |
Filtering and Viewing
| Filter | Description |
|---|---|
| Period | Shared period bar at the top — 1h / 6h / 1d / 7d / 30d / All / Custom |
| Source | All sources or only a specific source (general chat · agent · code gateway · API) |
| Model | All models or only a specific model |
| User | Search and select by user name |
Only items that actually have conversation records appear as candidates in the source, model, and user filters.
Difference from Usage
Conversation Logs view the same token data as Usage, but the unit you look at differs.| Aspect | Usage | Conversation Logs |
|---|---|---|
| Unit | Aggregated by period, model, user | A single request |
| Form | Charts, totals | Row-level table |
| Main use | Token/cost trends, identifying top users/models | Tracing individual requests of a specific user, model, or agent |
Use Cases
Tracking a specific user's usage history
Tracking a specific user's usage history
- Enter a name in the User filter to view only that user
- Narrow the Period to find requests at the point you want to check
- Use Model, Agent, and Total tokens to identify which requests consumed the most tokens
Identifying high-cost requests
Identifying high-cost requests
- Select a high-priced model with the Model filter
- Look at rows with large Total tokens to find token-heavy requests
- Compare against the overall trend for the same model in Usage
Reviewing agent and code gateway usage
Reviewing agent and code gateway usage
- Use the Source filter to see only agent or code gateway requests
- Use the Agent column to check which agents are called
- Use the Platform column to see which client the requests come from
Related Logs
- Aggregate trends: Usage — summarizes tokens and cost by period, model, and user
- Activity audit: Audit Logs — records resource changes, sign-ins, and other activity
- Retention period: Accumulated logs are cleaned up per the Data Retention setting