Admin › Monitoring › Guardrail Logs
- Transparently track which user entered which sensitive info and how which guardrail processed it.
The same guardrail logs can also be viewed from Admin > Code Gateway > Guardrail Logs.
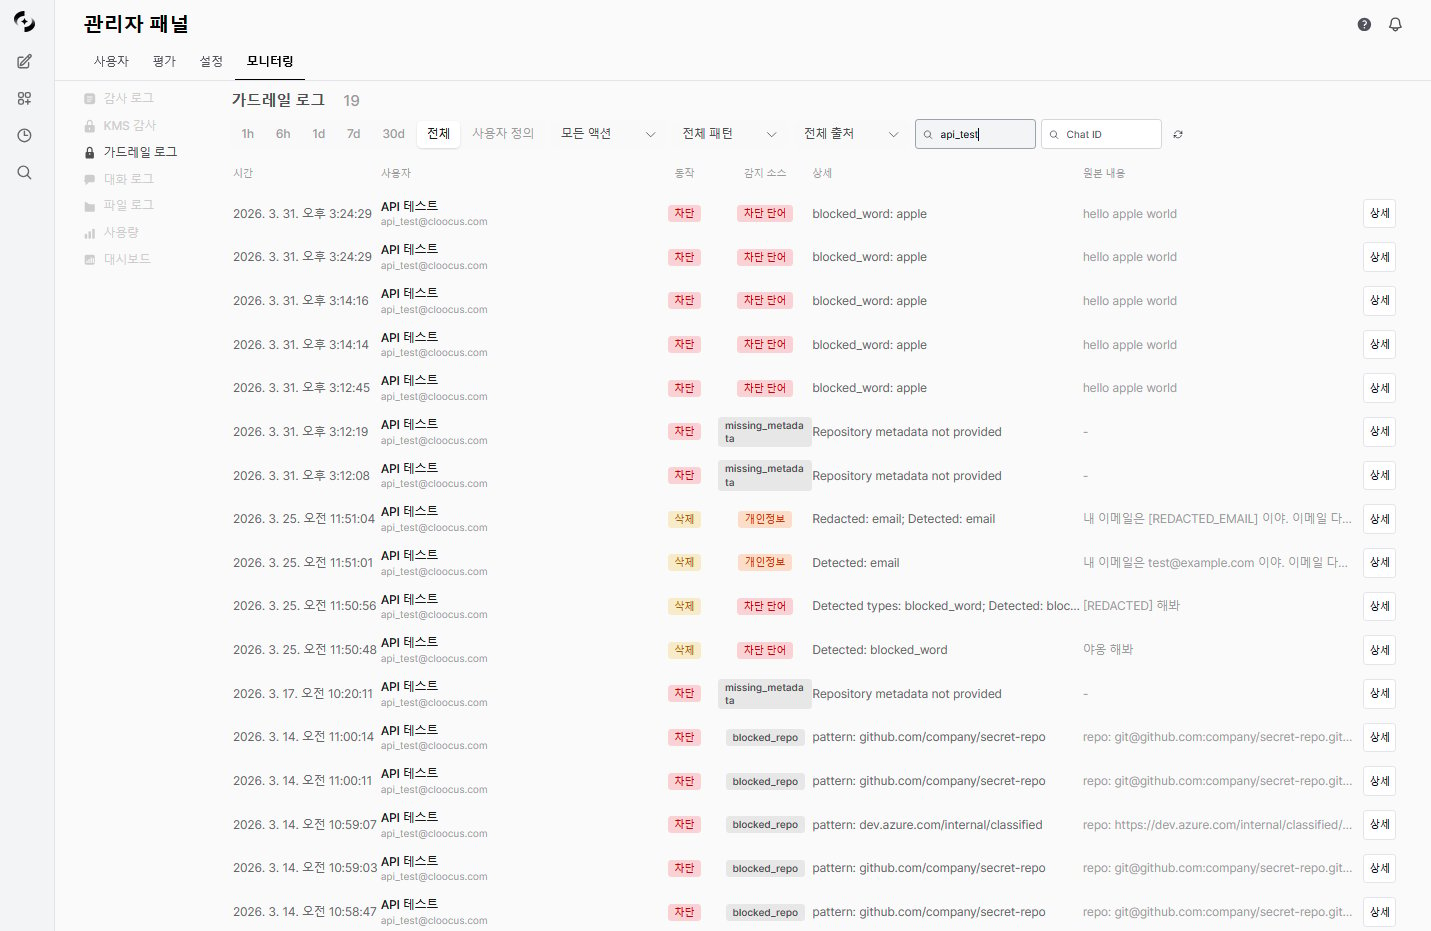
Guardrail Logs main screen — filter area, log table
What are Guardrail Logs?
When users converse with the AI, guardrails validate inputs and outputs.- When sensitive info is detected, the configured strategy (block, redact, mask, etc.) is applied and the result is logged.
Log Entry Structure
Each guardrail log entry includes:Action Types
Detection Pattern
Detection methods are grouped into two categories.
Individual source meanings:
Filter Options
Log Detail View
Click a log entry to see details.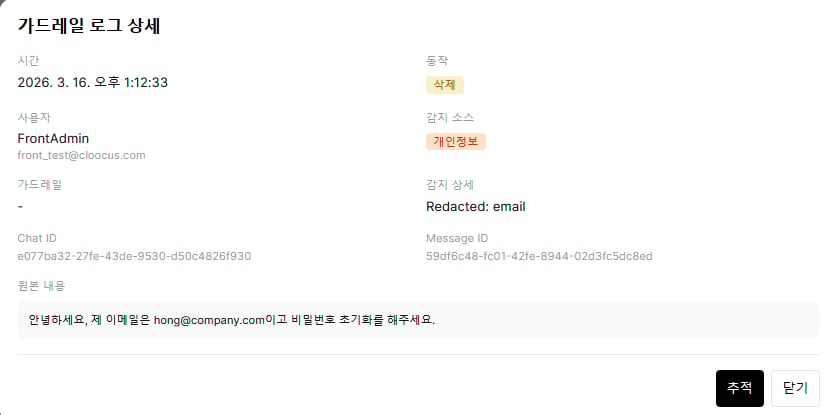
Guardrail log detail modal — detection info, original content, and the Trace button at the bottom-right
- Detection Details
- Context
Tracing Integration
In guardrail log details, the Trace button lets you see the complete processing of that message.1
Pick an entry in Guardrail Logs
Click the log entry for the guardrail event you’re investigating.
2
Click Trace
Click the Trace button at the bottom-right of the detail modal.
3
View full processing
The Trace Detail screen opens, showing the full Run tree — including the guardrail check for that message. Guardrail Runs are shown with red GD badges.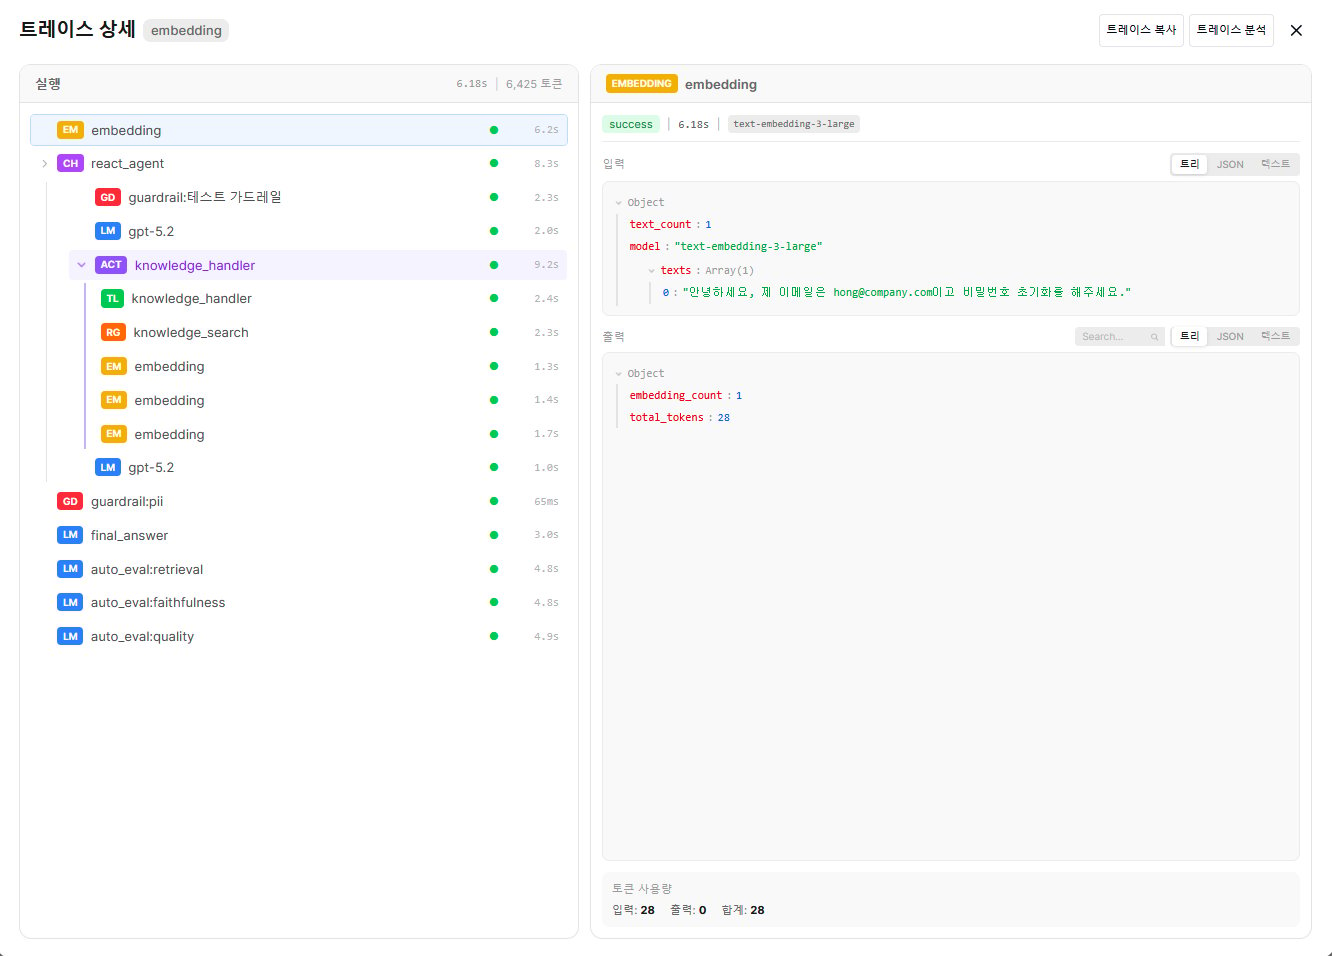
Trace Detail — guardrail steps (GD badges) in the left Run tree and per-step input/output on the right
Use Cases
Guardrail Policy Tuning
Guardrail Policy Tuning
- Set a time range and view logs by Detection Pattern
- Review
logaction events to gauge false positive rate - Adjust regex or exclude patterns with many false positives
- Add new patterns or blocked words for missed detections
Security Incident Response
Security Incident Response
- Look up a specific user’s guardrail events via user search
- Check repeated
blockpatterns - Review original content to determine intentional sensitive info leak attempts
- Cross-analyze with related audit logs for full context
LLM Judge Effectiveness Analysis
LLM Judge Effectiveness Analysis
- Filter Detection Pattern to
LLM-based - Review original content of blocked messages
- If excessive blocking, strengthen allow examples in the Judge prompt
- If missing blocks, add block examples
Guardrail Settings Integration
Improve guardrail settings based on patterns found in guardrail logs.See Guardrails for guardrail configuration.